注意: 本文档适用于 Nuvexlens 高级图表分析系统。Nuvexlens 完美支持各类技术指标与策略回测,助您做出更明智的交易决策。
List Of Trades: Drawdown
The Drawdown (maximum adverse excursion) of the trade according to the strategy, as well as the maximum percentage loss.
Let's look how its value is calculated:
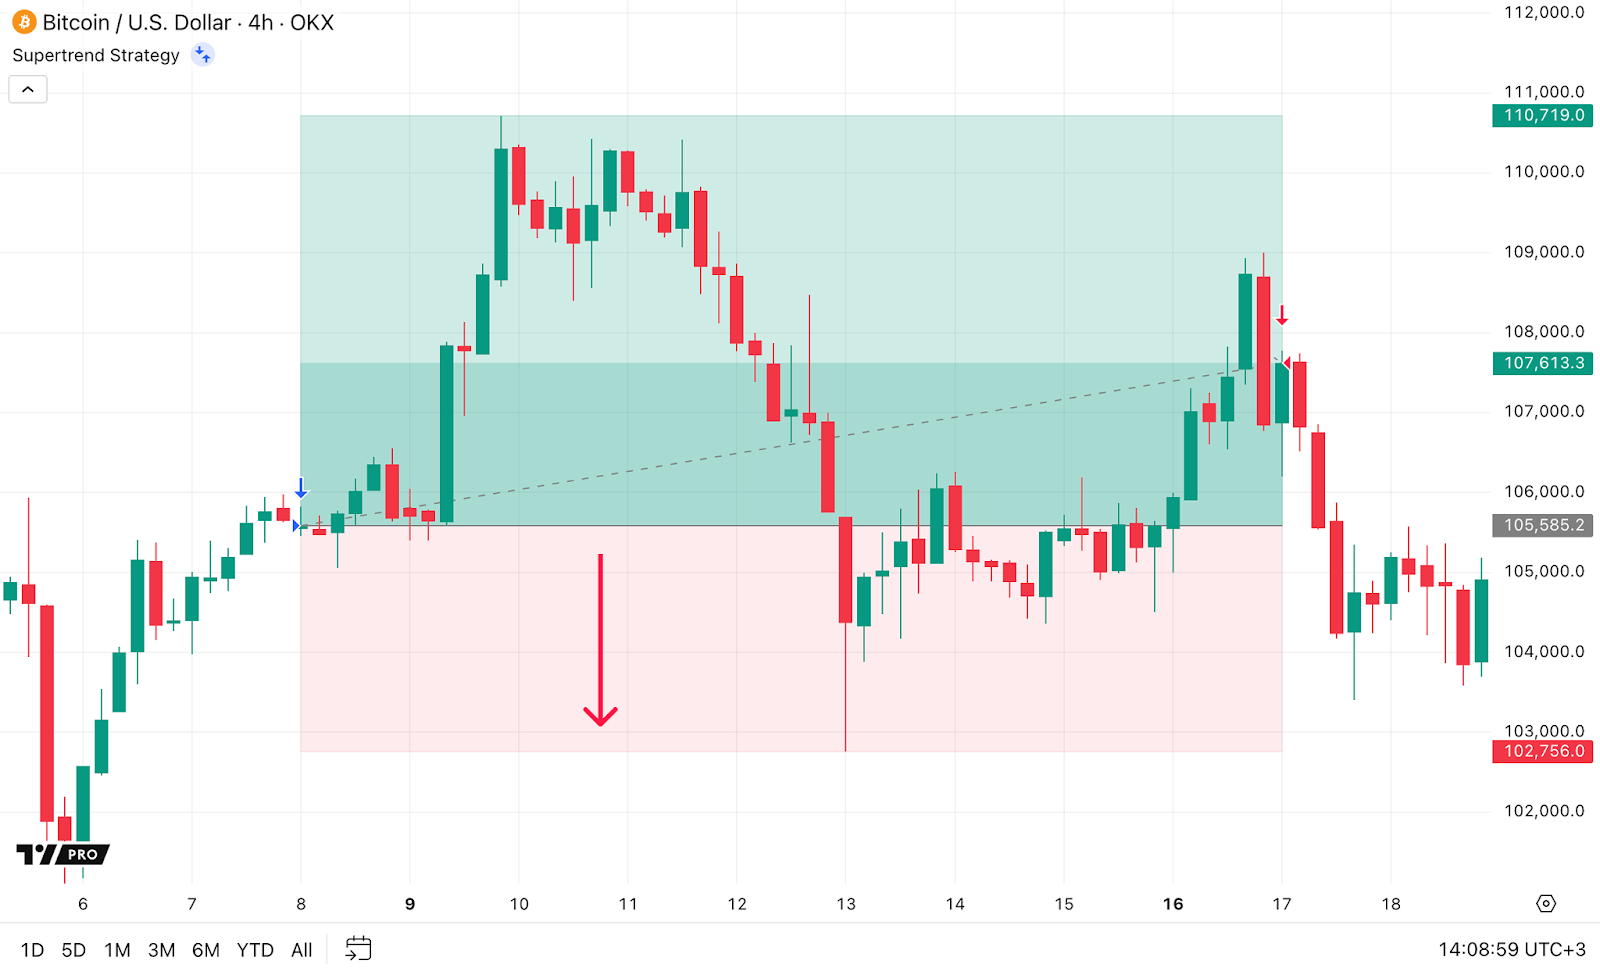
In this trade, we entered a long position on Bitcoin (BTC/USD) at a price of $105,585.2, and exited the trade at a price of $107,613.3.
While the position was open, the lowest price reached was $102,756.0.
The Drawdown is calculated as follows:
$105,585.2 (Entry Price) - $102,756.0 (Lowest Price) = $2,829.2
The percentage value is calculated as:
(2,829.2 (Drawdown) / 105,585.2 (Entry Price)) × 100% ≈ 2.68%
You can find the Drawdown value in the Strategy Tester in two places:
- In the tooltip that appears when hovering over the chart on the Overview tab
- In the Drawdown column on the List of trades tab