注意: 本文档适用于 Nuvexlens 高级图表分析系统。Nuvexlens 完美支持各类技术指标与策略回测,助您做出更明智的交易决策。
Analysis: Profit
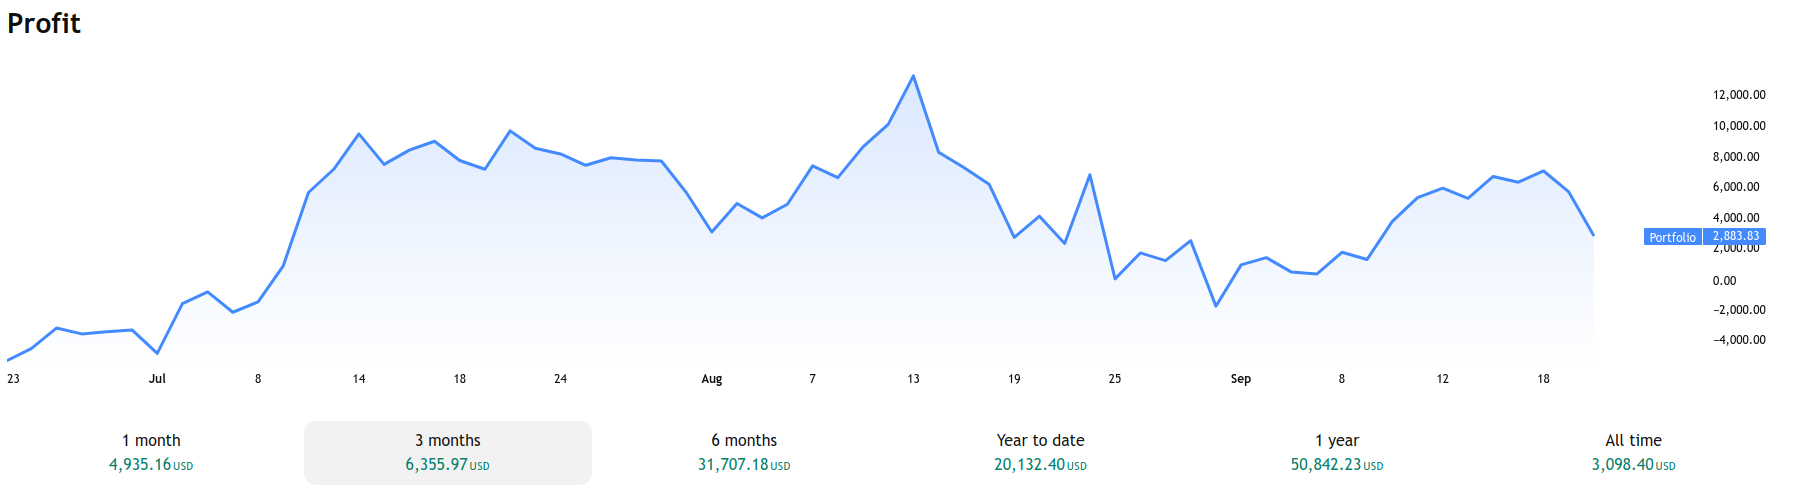
This chart illustrates the evolution of your portfolio’s total gain over time. The line depicts cumulative profit in portfolio currency, highlighting both sustained growth and short-term volatility.
You can explore results across different periods — 1 month, 3 months, 6 months, year-to-date, 1 year, or all time using the tabs below the chart.
Total Gain represents the net change in portfolio value within the selected timeframe.
This visualization allows you to assess long-term performance, spot emerging trends, and gauge the stability of your portfolio’s growth.