Note: This documentation applies to the Nuvexlens Advanced Charting System. Nuvexlens fully supports technical indicators and strategy backtesting to help you make smarter trading decisions.
I'd like to change how PnL is shown on the chart
You can customize how profit & loss (PnL) is displayed on the chart in your Trading settings:
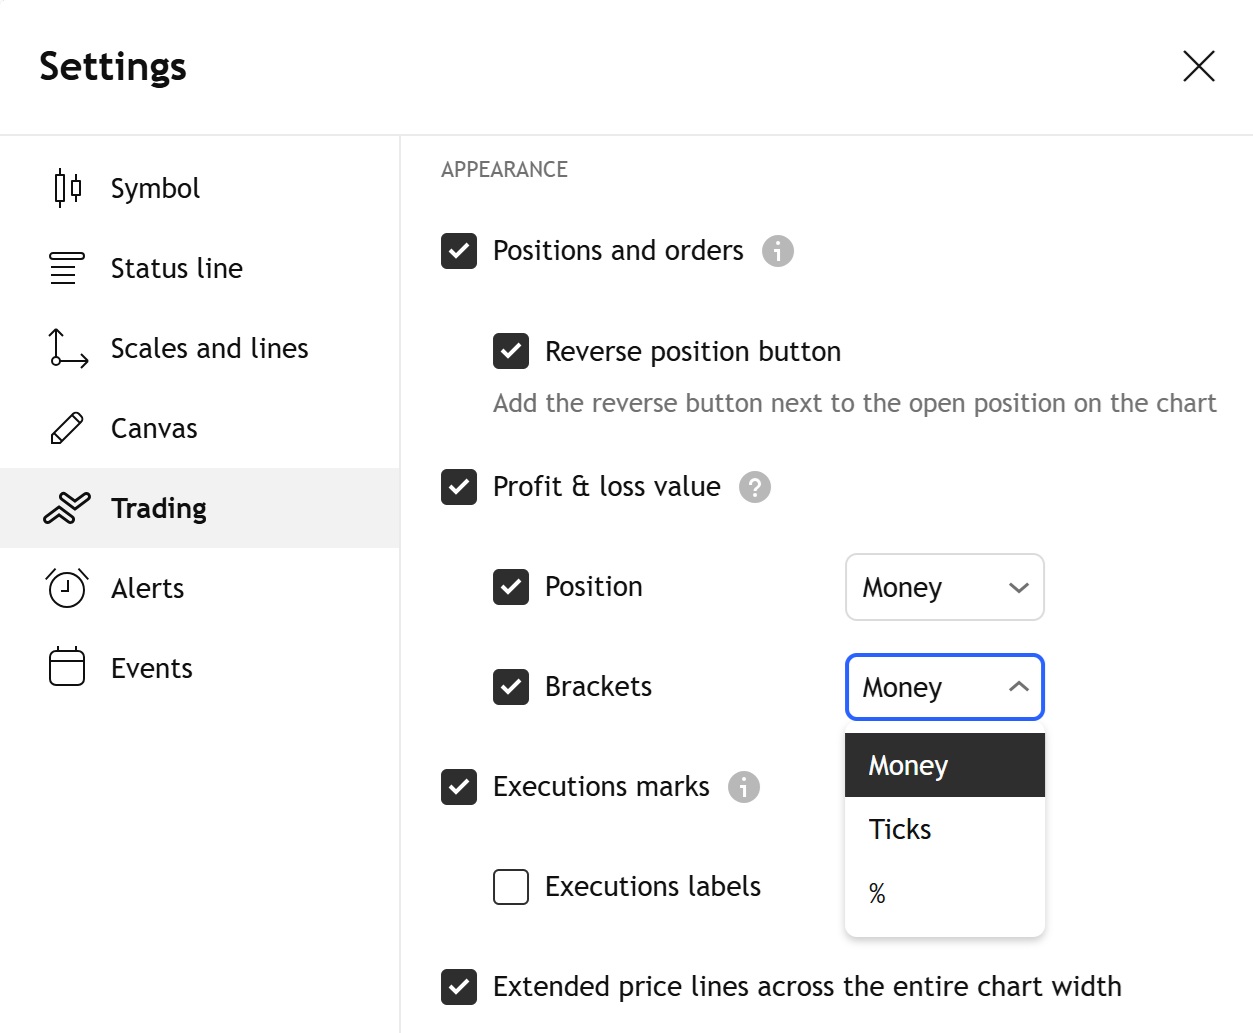
Available display formats:
- Money ($) – shows your PnL in the monetary value (e.g. +$25.00).
Useful for quickly assessing how much you’ve made or lost in absolute terms.
- Ticks – displays PnL in tick units(or pips for forex symbols) (e.g. +5 ticks).
A common choice for traders who work with tick-based strategies.
- Percentage (%) – shows PnL relative to the entry price (e.g. +2.5%).
Helpful for comparing performance across different trades or instruments.
You can configure these settings separately for:
- Active positions
- Bracket orders (Take Profit and Stop Loss levels)
This gives you flexibility to view PnL in the format that best suits your trading style.