Trend Strength Index
The Trend Strength Index indicator measures the tendency of a symbol to either trend steadily or to revert to its mean. The core idea behind TSI is that the more momentum a symbol has relative to its volatility, the more likely it is to follow a trend and less likely to revert to its mean.
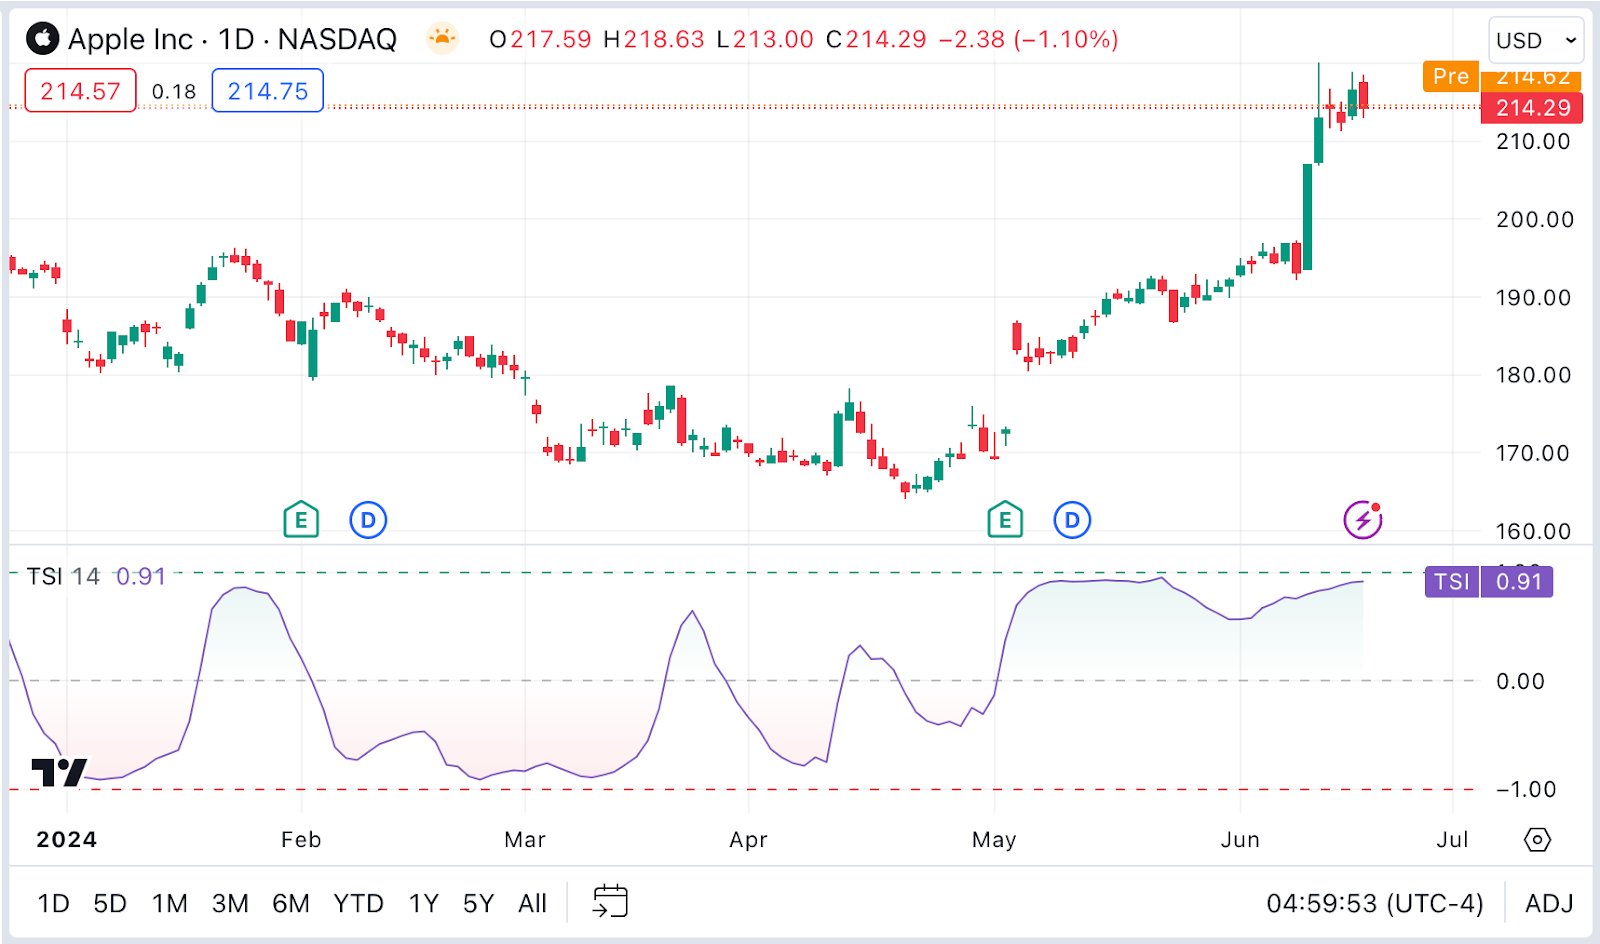
This indicator analyzes price momentum using the Pearson correlation coefficient, a normalized measure of the linear relationship between time series. Its output shows the correlation between the chart's closing prices and bar index values over a defined number of bars.
A chart's bar index starts at 0 and increases by one for each successive bar. In other words, the bar index represents points on a straight line with a slope of 1. The correlation between this index and price data is a measure of momentum, as it reflects how steadily price moved compared to a consistent linear trend. Traders can use this indicator to gauge the strength and consistency of price activity over time:
- A value near 1 shows that prices experienced relatively steady increases across successive bars, indicating high upward trend strength.
- A value near -1 shows that prices experienced relatively steady decreases across successive bars, indicating high downward trend strength.
- A value near 0 suggests a lack of trend strength, because prices did not demonstrate a steady positive or negative relationship with the bar index.
Inputs
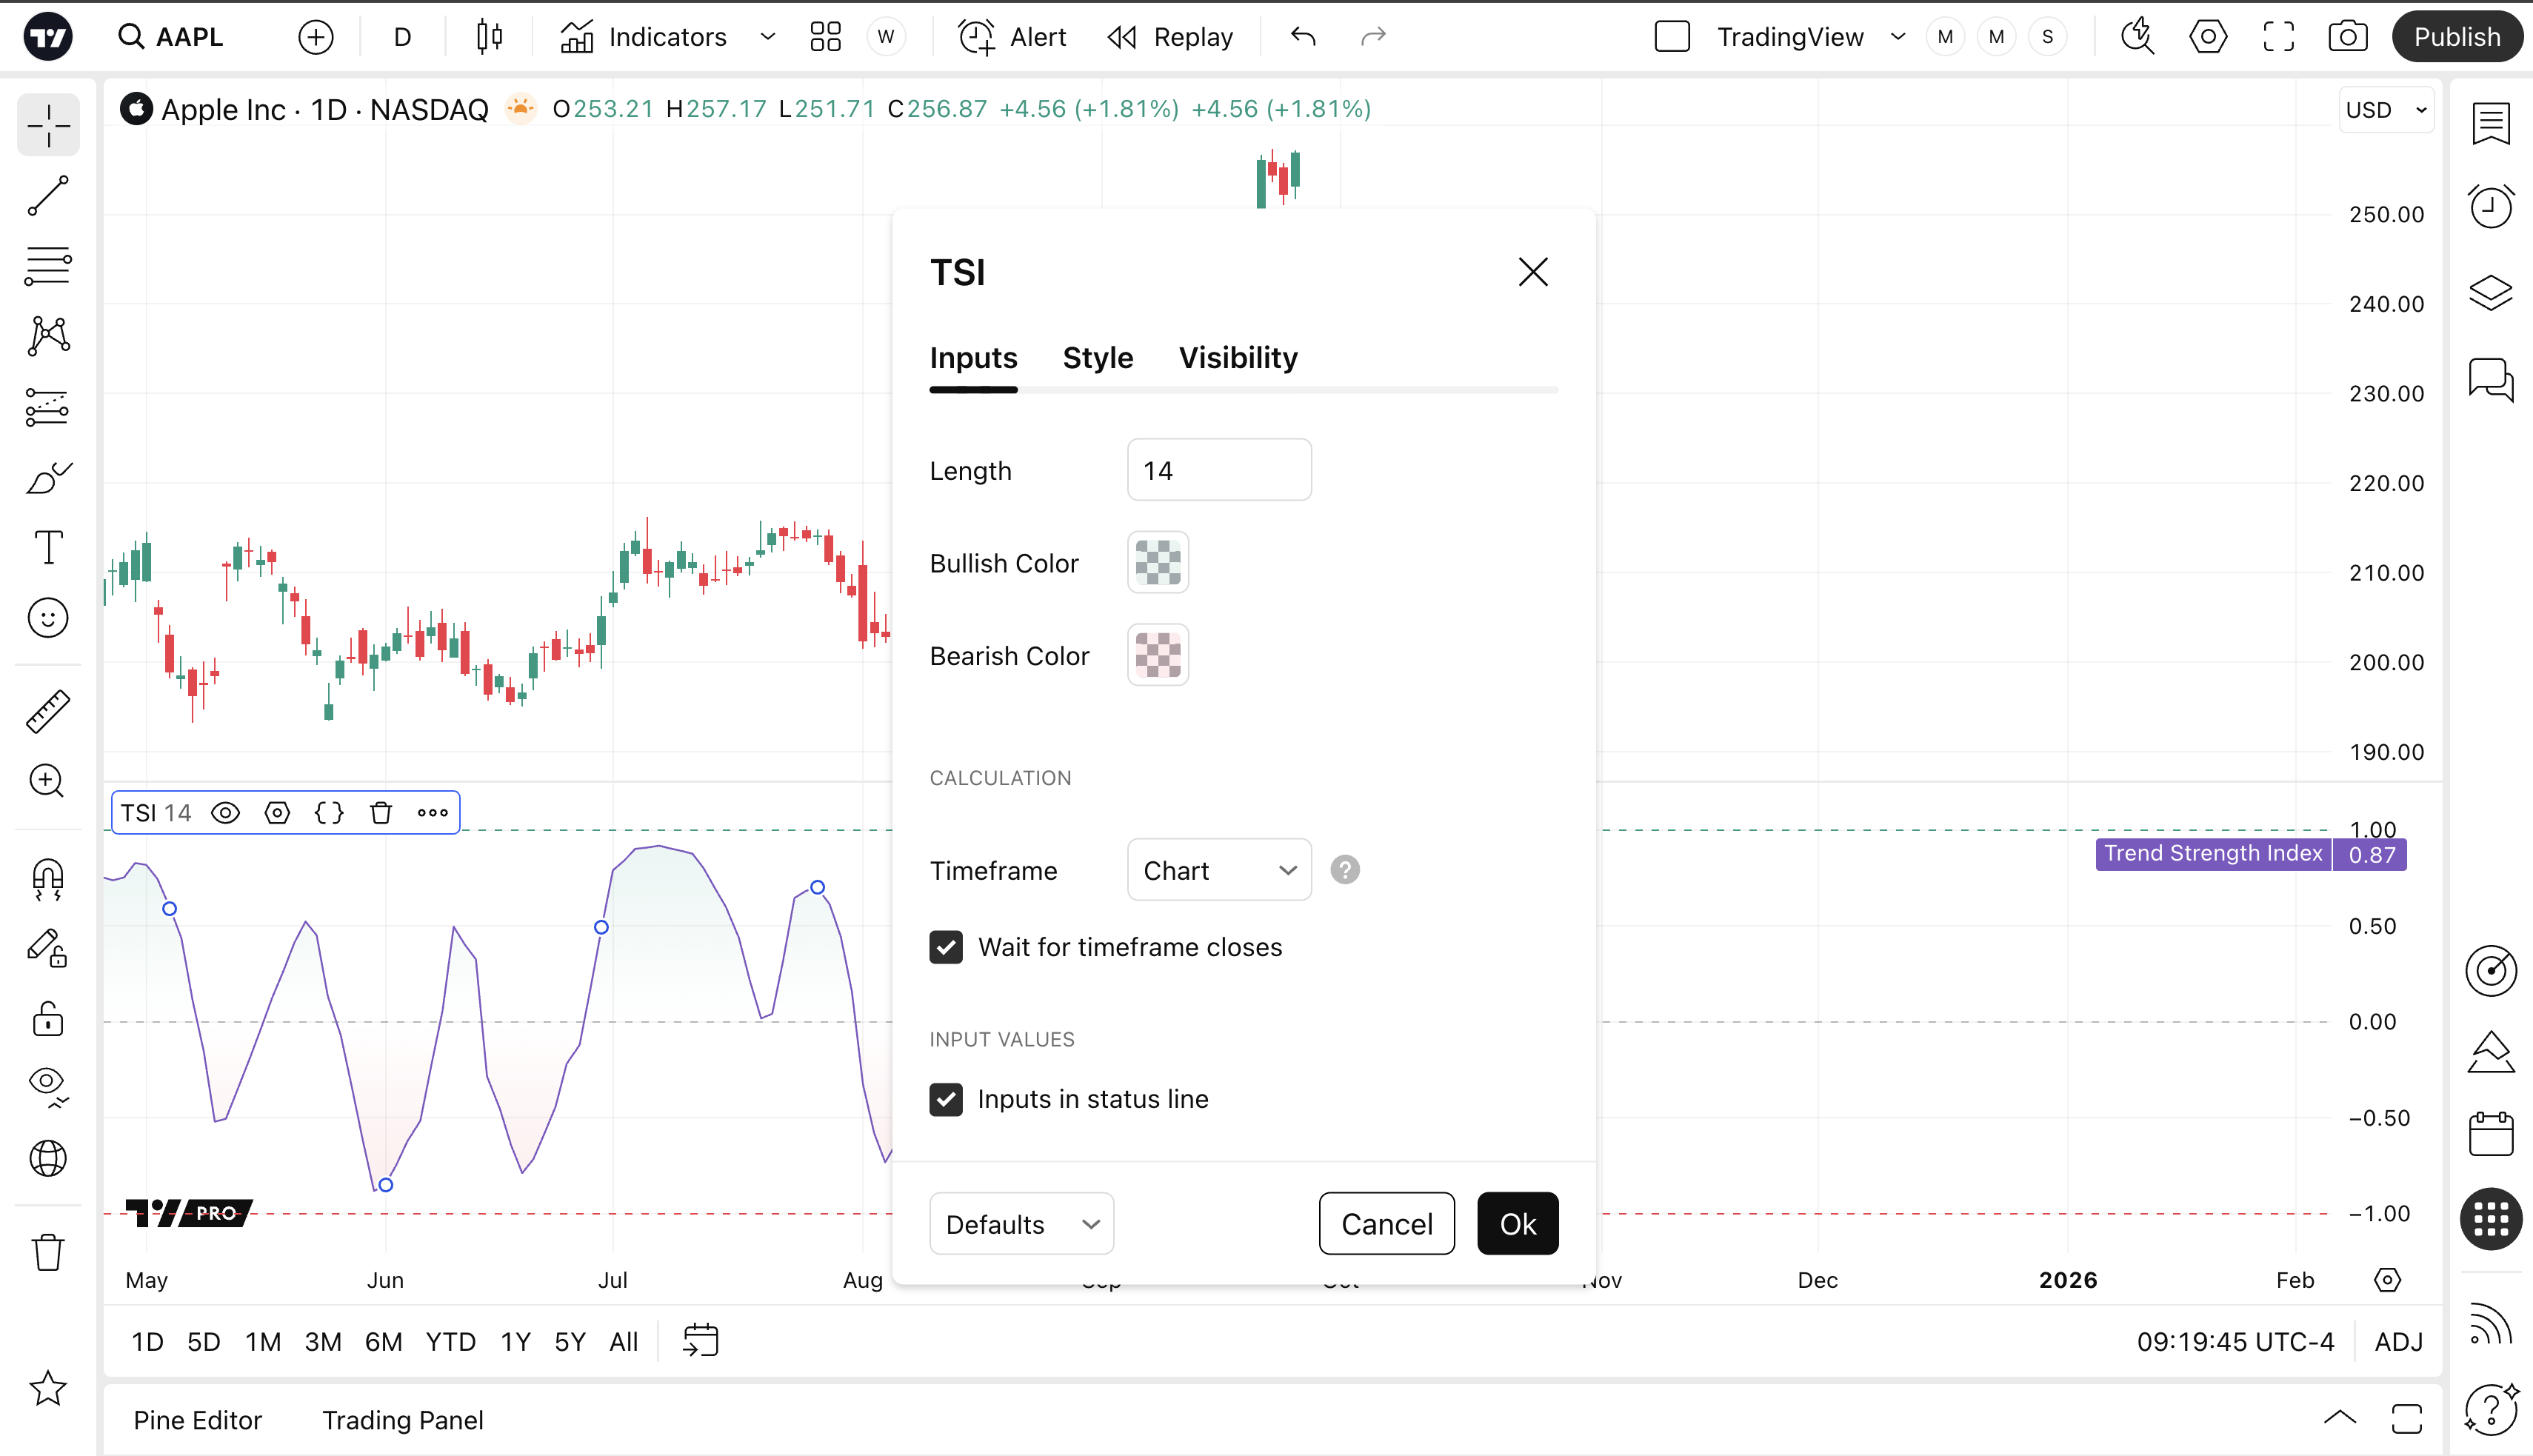
Length
The number of bars used to calculate the Trend Strength Index.
Bullish/Bearish Color
The colors that represent a positive trend and a negative trend, respectively.
Changing the transparency of the color affects the gradient that colors the space between the main TSI plot and zero: the gradient starts fully transparent at zero and reaches the transparency specified in the input at 1 for the Bullish Color and -1 for the Bearish Color.