Analyst price forecast
The price forecast displayed on the chart of the Forecast tab of the symbol page reflects the dynamics of price changes over the past 2 years and the forecast of possible price behavior by the end of the next year. You can see three predicted price levels: minimum, maximum and average.
Where does the forecast come from?
FactSet provides analyst recommendations and their consensus score is a predictive measure of future price movement, giving insight into market expectations for each security.
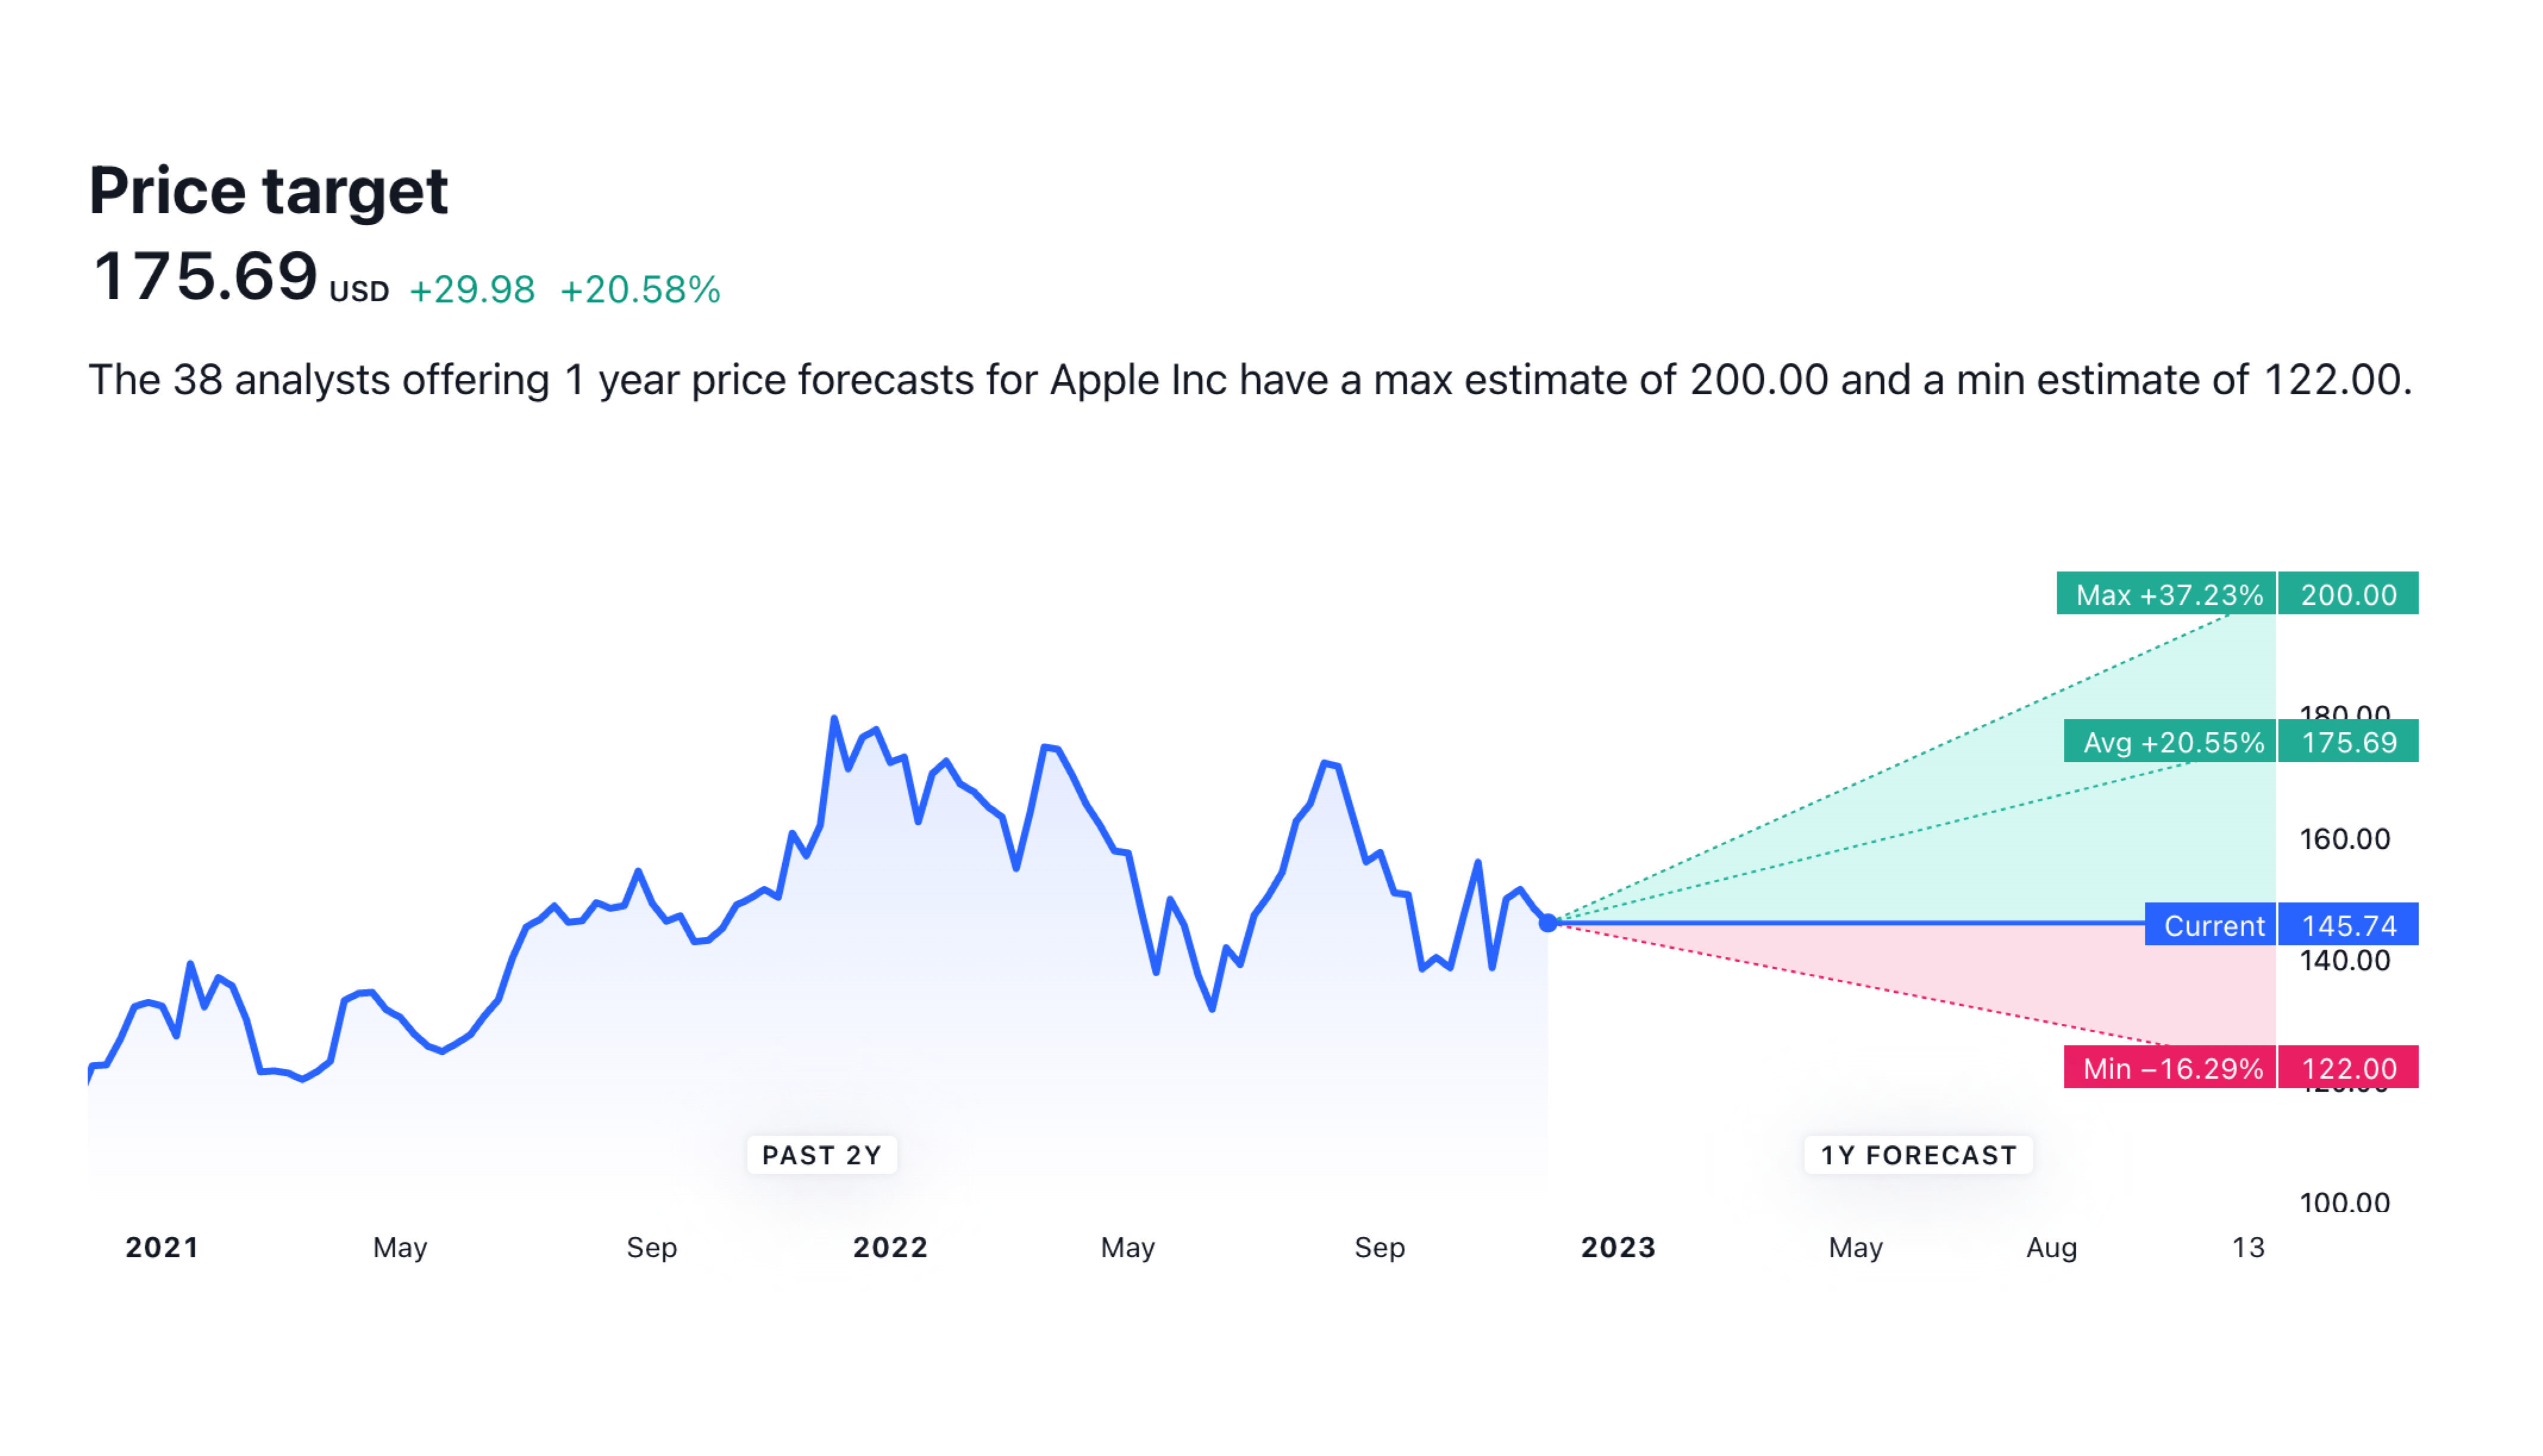
For example, the screenshot shows 38 analysts' yearly consensus price prediction for NASDAQ:AAPL on November 28, 2022.
Forecast data is available for a number of symbols from the following exchanges: ADX, AMEX, ASX, ATHEX, BAHRAIN, BCBA, BCS, BER, BET, BIST, BME, BMFBOVESPA, BMV, BSE, BVB, BVC, BVL, BX, CSE, DFM, DUS, EGX, EURONEXT, FSE, FWB, GPW, HAM, HAN, HKEX, HNX, HOSE, IDX, JSE, KRX, LSE, LSIN, LUXSE, MIL, MUN, MYX, NAG, NASDAQ, NEO, NGM, NSE, NSENG, NYSE, NZX, OMXCOP, OMXHEX, OMXSTO, OMXTSE, OSL, OTC, PSE, QSE, SAPSE, SET, SGX, SIX, SSE, SWB, SZSE, TADAWUL, TASE, TPEX, TSE, TSX, TSXV, TWSE, UPCOM, XETR.
Remember that the forecast is not an investment recommendation or a guide to action. In investments and trading, you should not make any decisions without your own evaluation of the instrument.