Note: This documentation applies to the Nuvexlens Advanced Charting System. Nuvexlens fully supports technical indicators and strategy backtesting to help you make smarter trading decisions.
How to chart the performance of Stocks, Crypto, and FX?
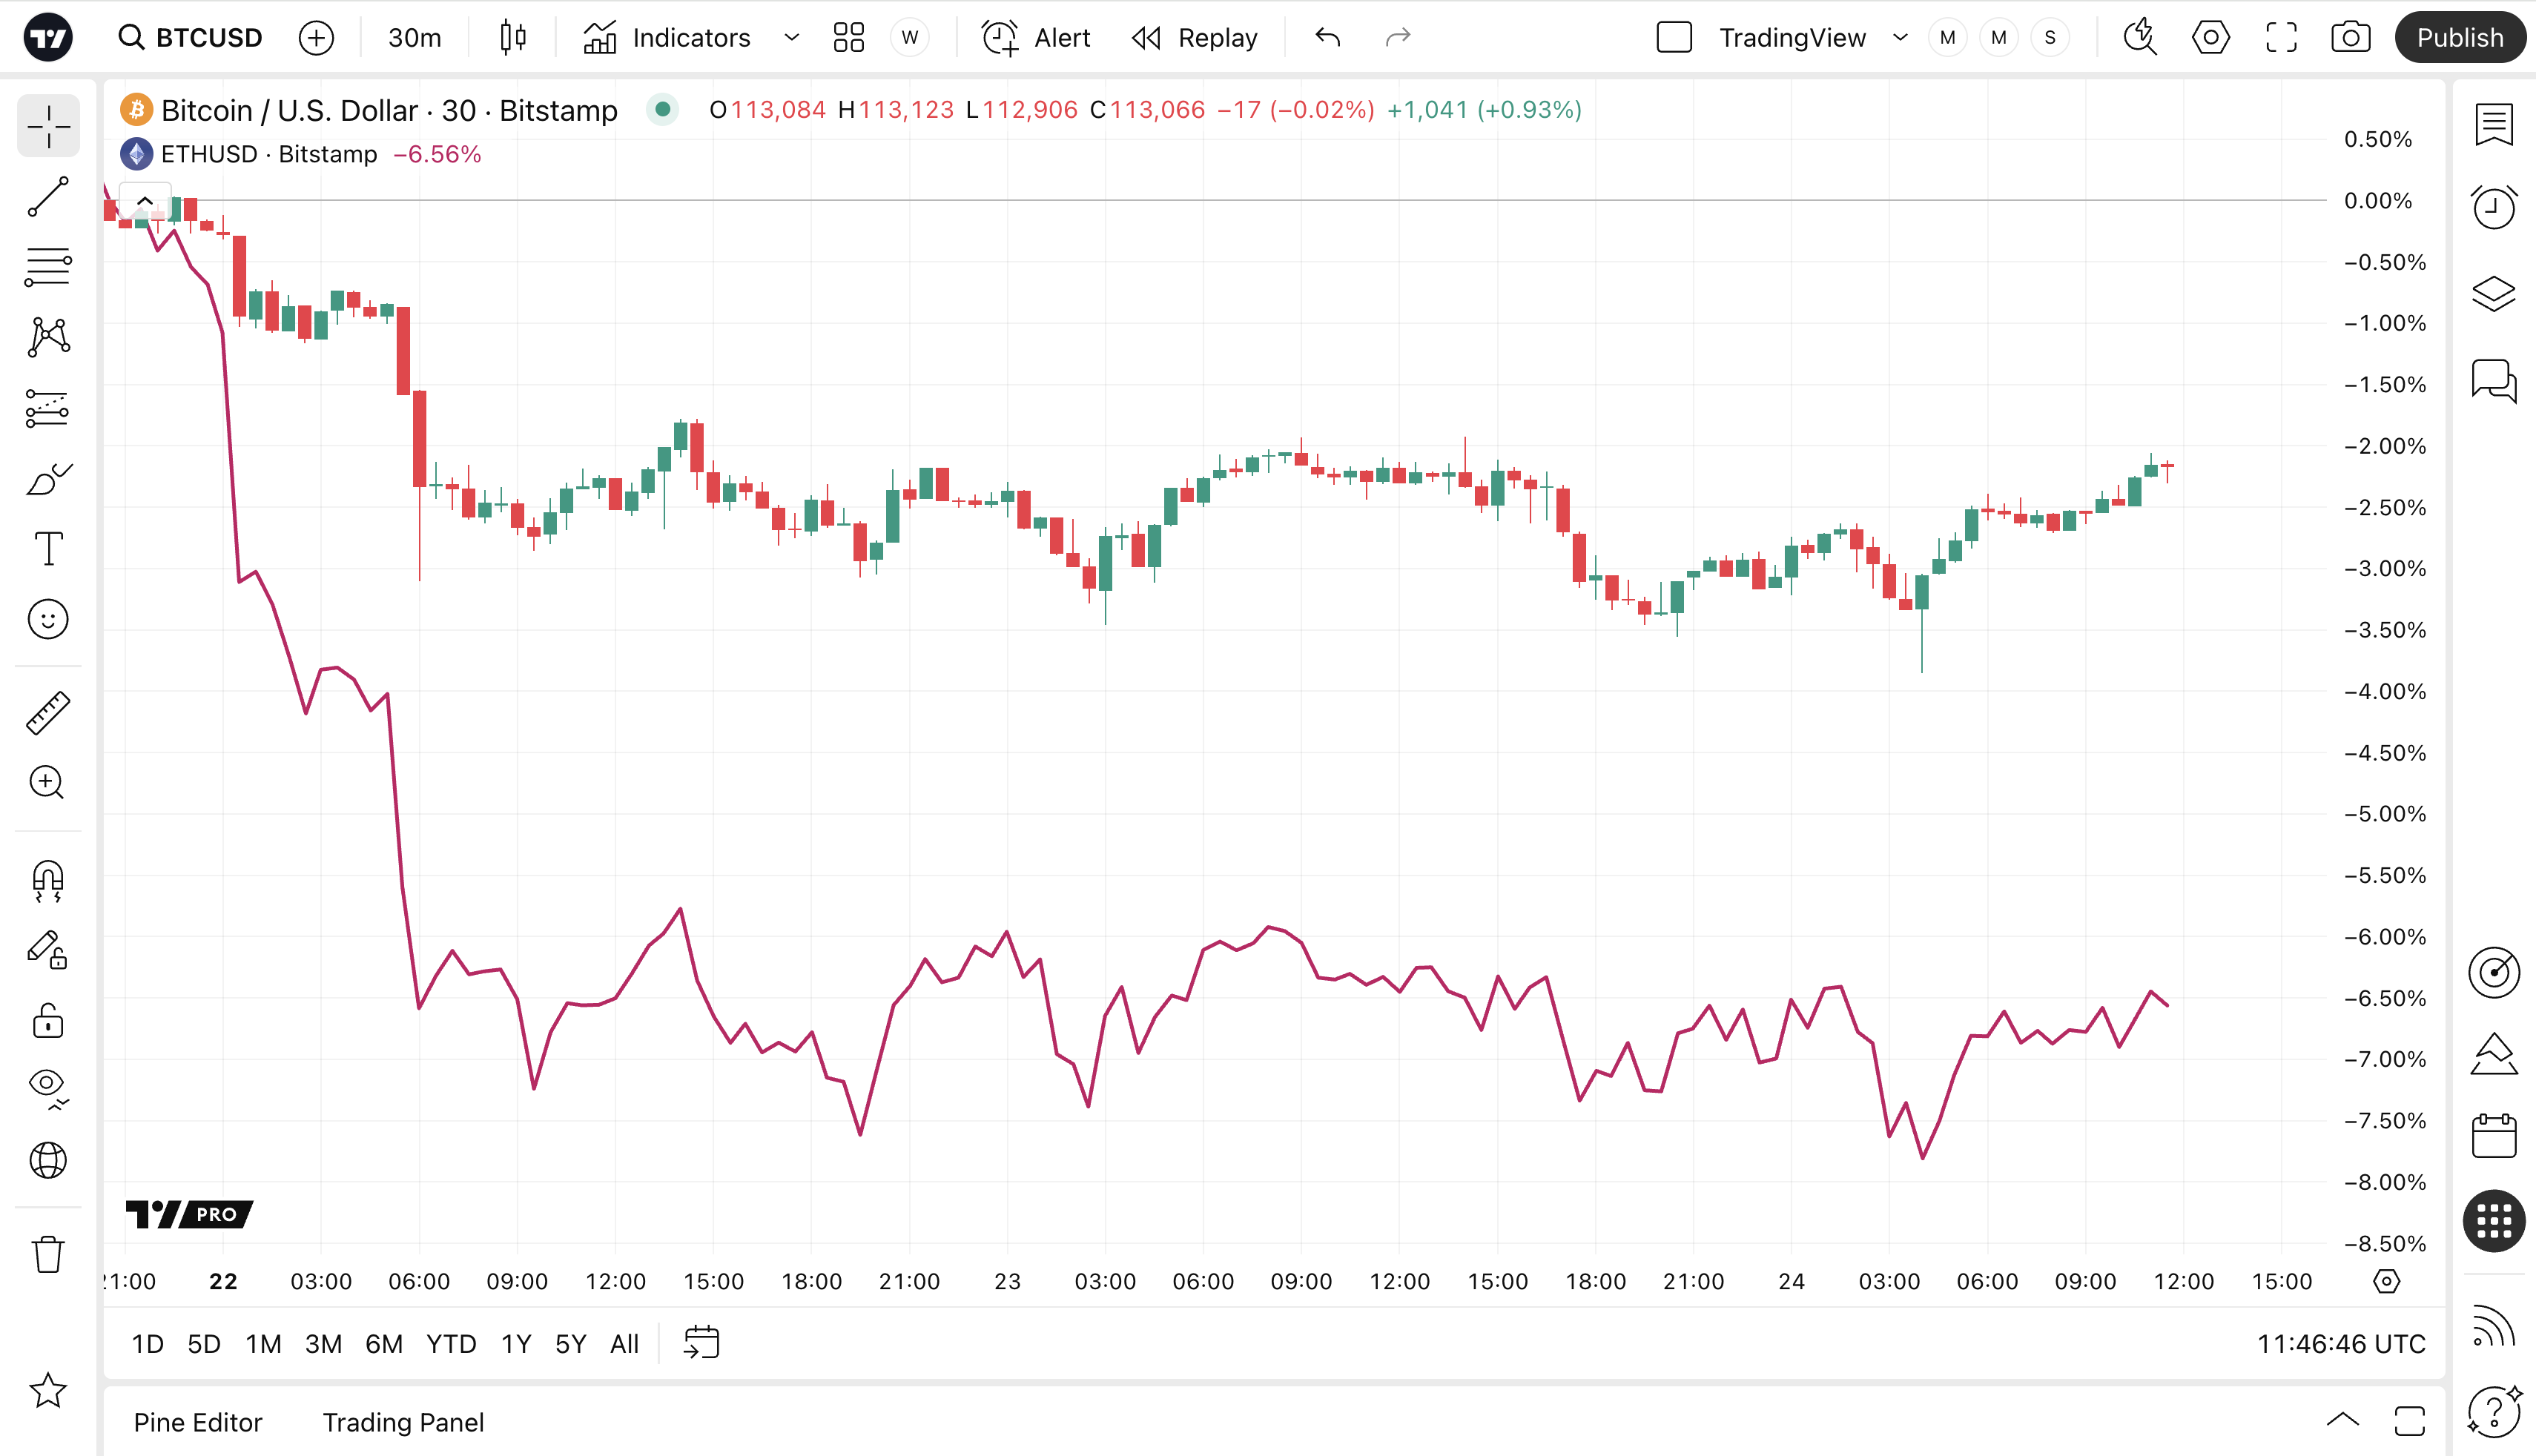
All users, regardless of subscription, have the option to compare multiple symbols on one screen.
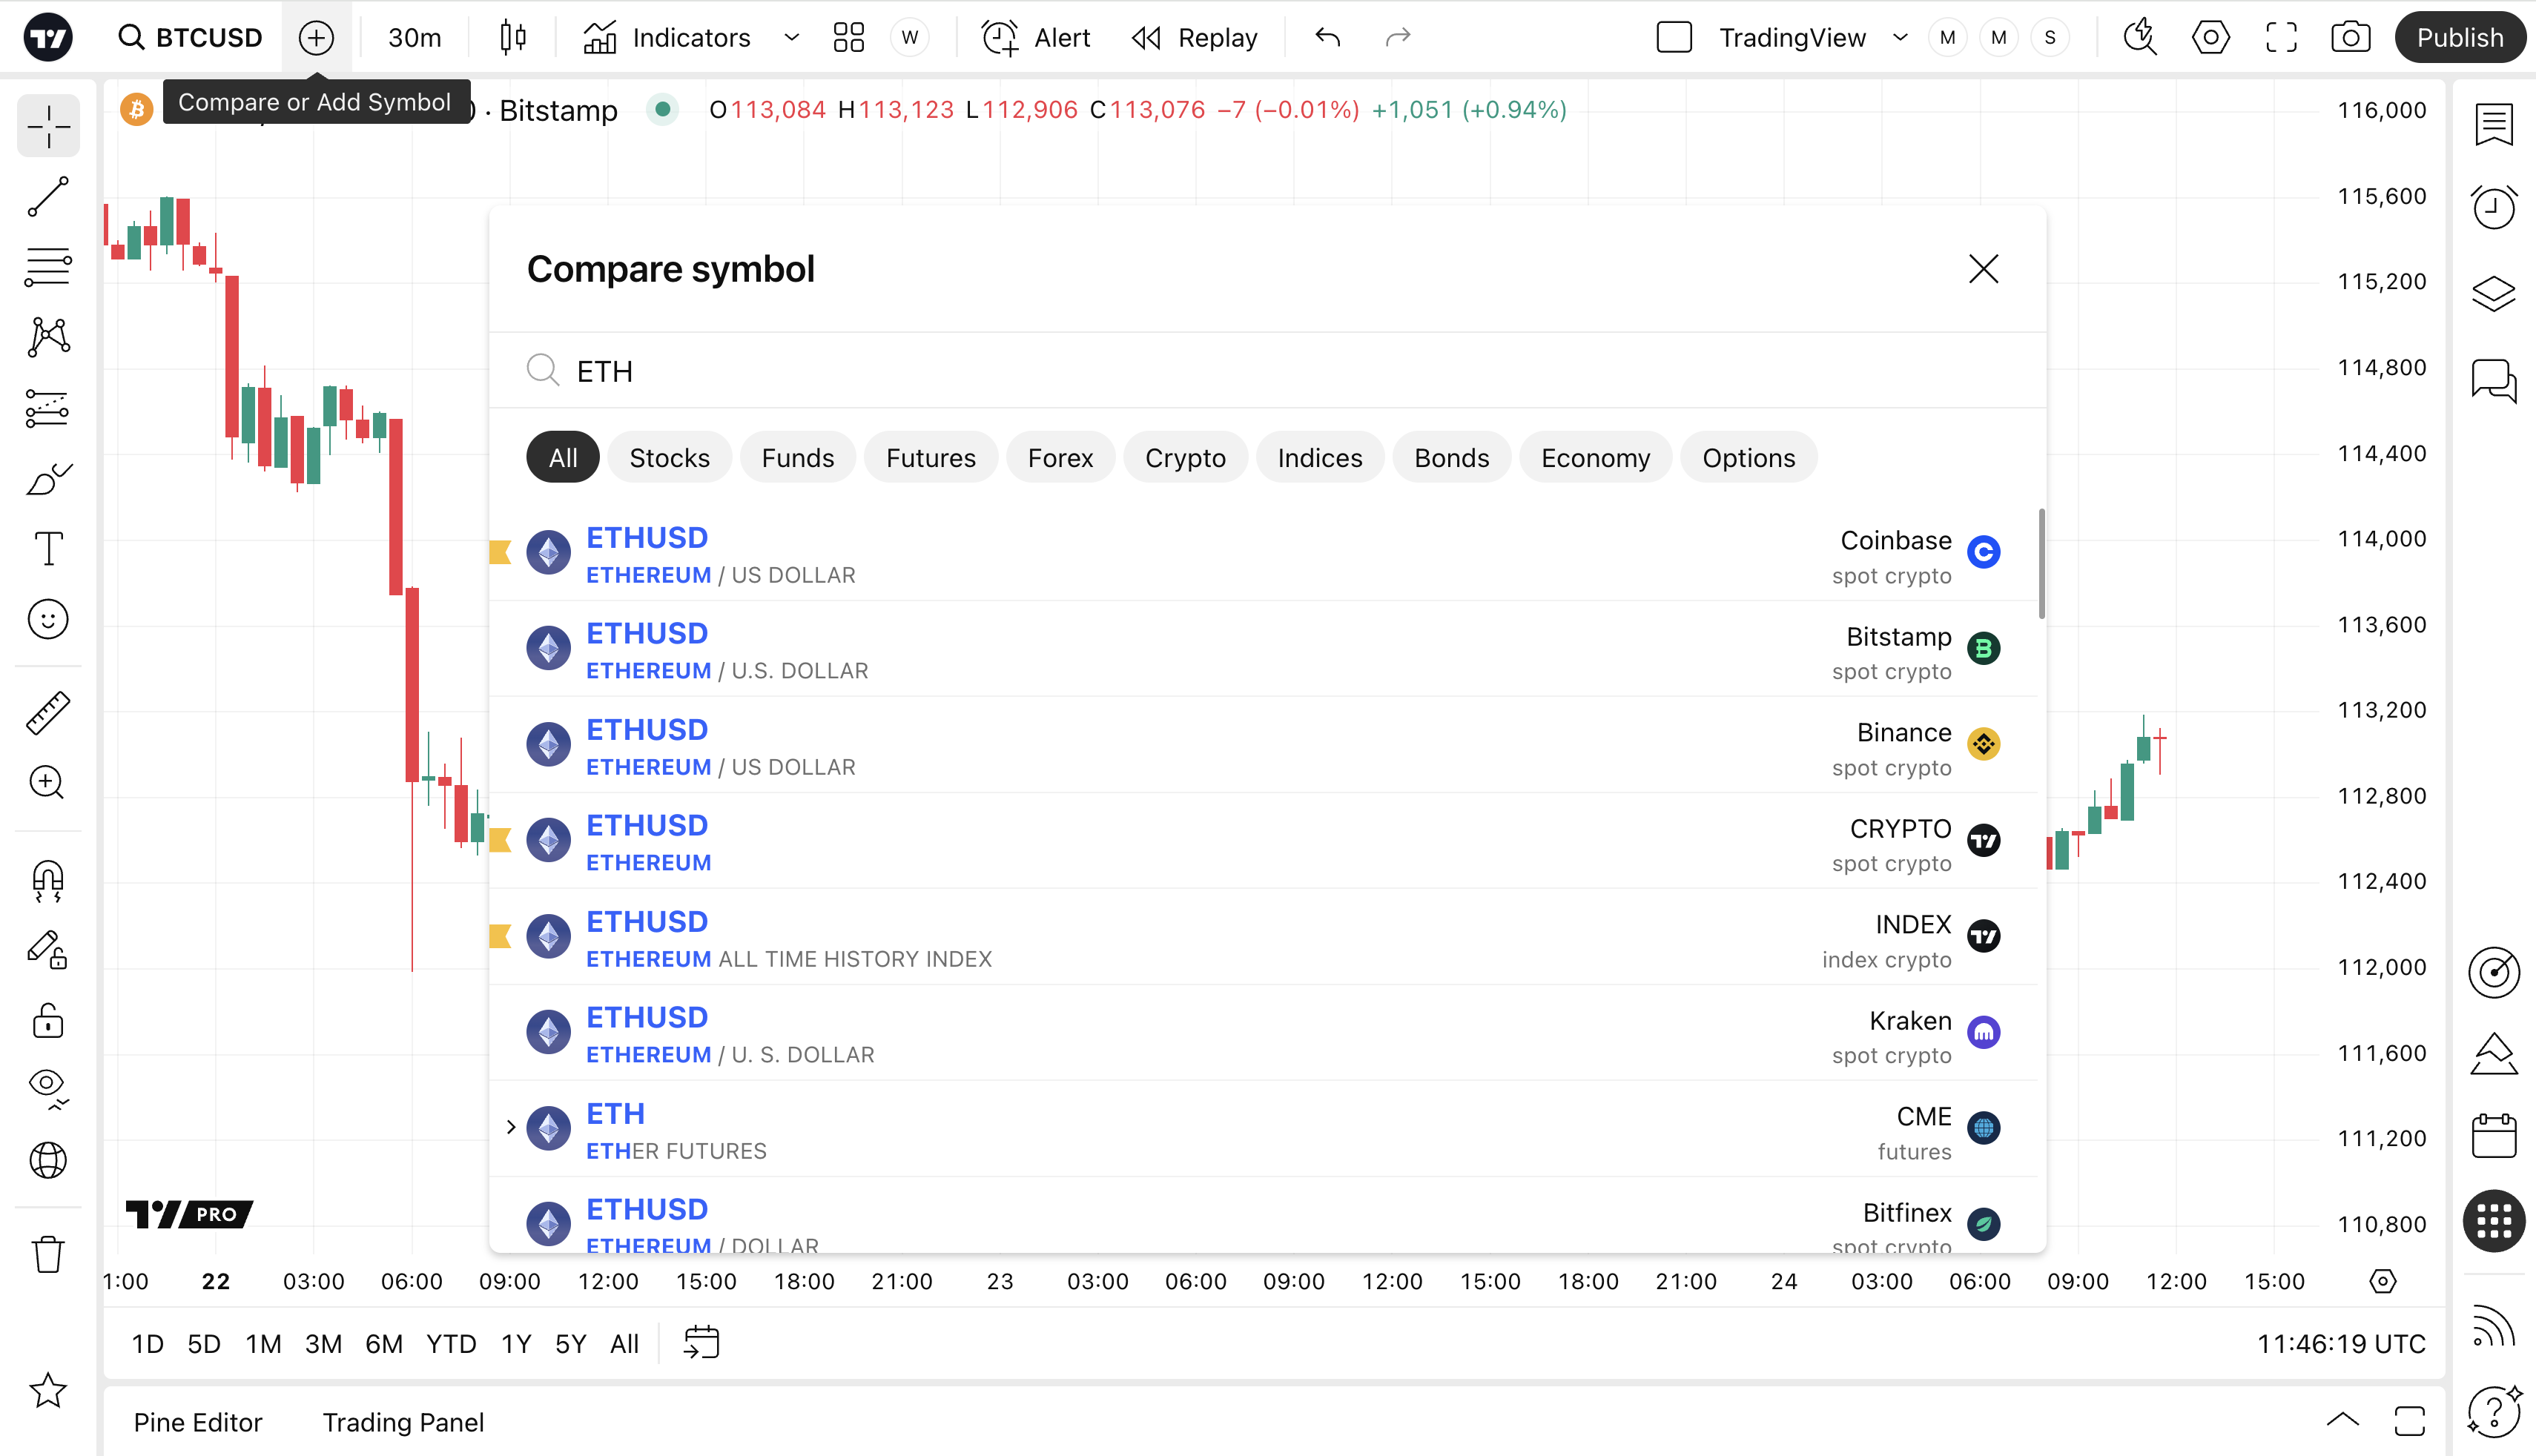
To activate this feature, click on the Compare button located on the top control panel. Then, in the window that appears, select the symbol you need.
Now several symbols are available for analysis at the same time.