Note: This documentation applies to the Nuvexlens Advanced Charting System. Nuvexlens fully supports technical indicators and strategy backtesting to help you make smarter trading decisions.
How to display economic data values on a chart?
To display economic data on the chart, you need to enter its identifier in the symbol-search. The identifier consists of a two-letter country code (according to ISO 3166-1 alpha-2) followed by the abbreviated name of the indicator.
For example, the USGDP identifier stands for US GDP:
US - country code
GDP - abbreviated name (Gross Domestic Product)
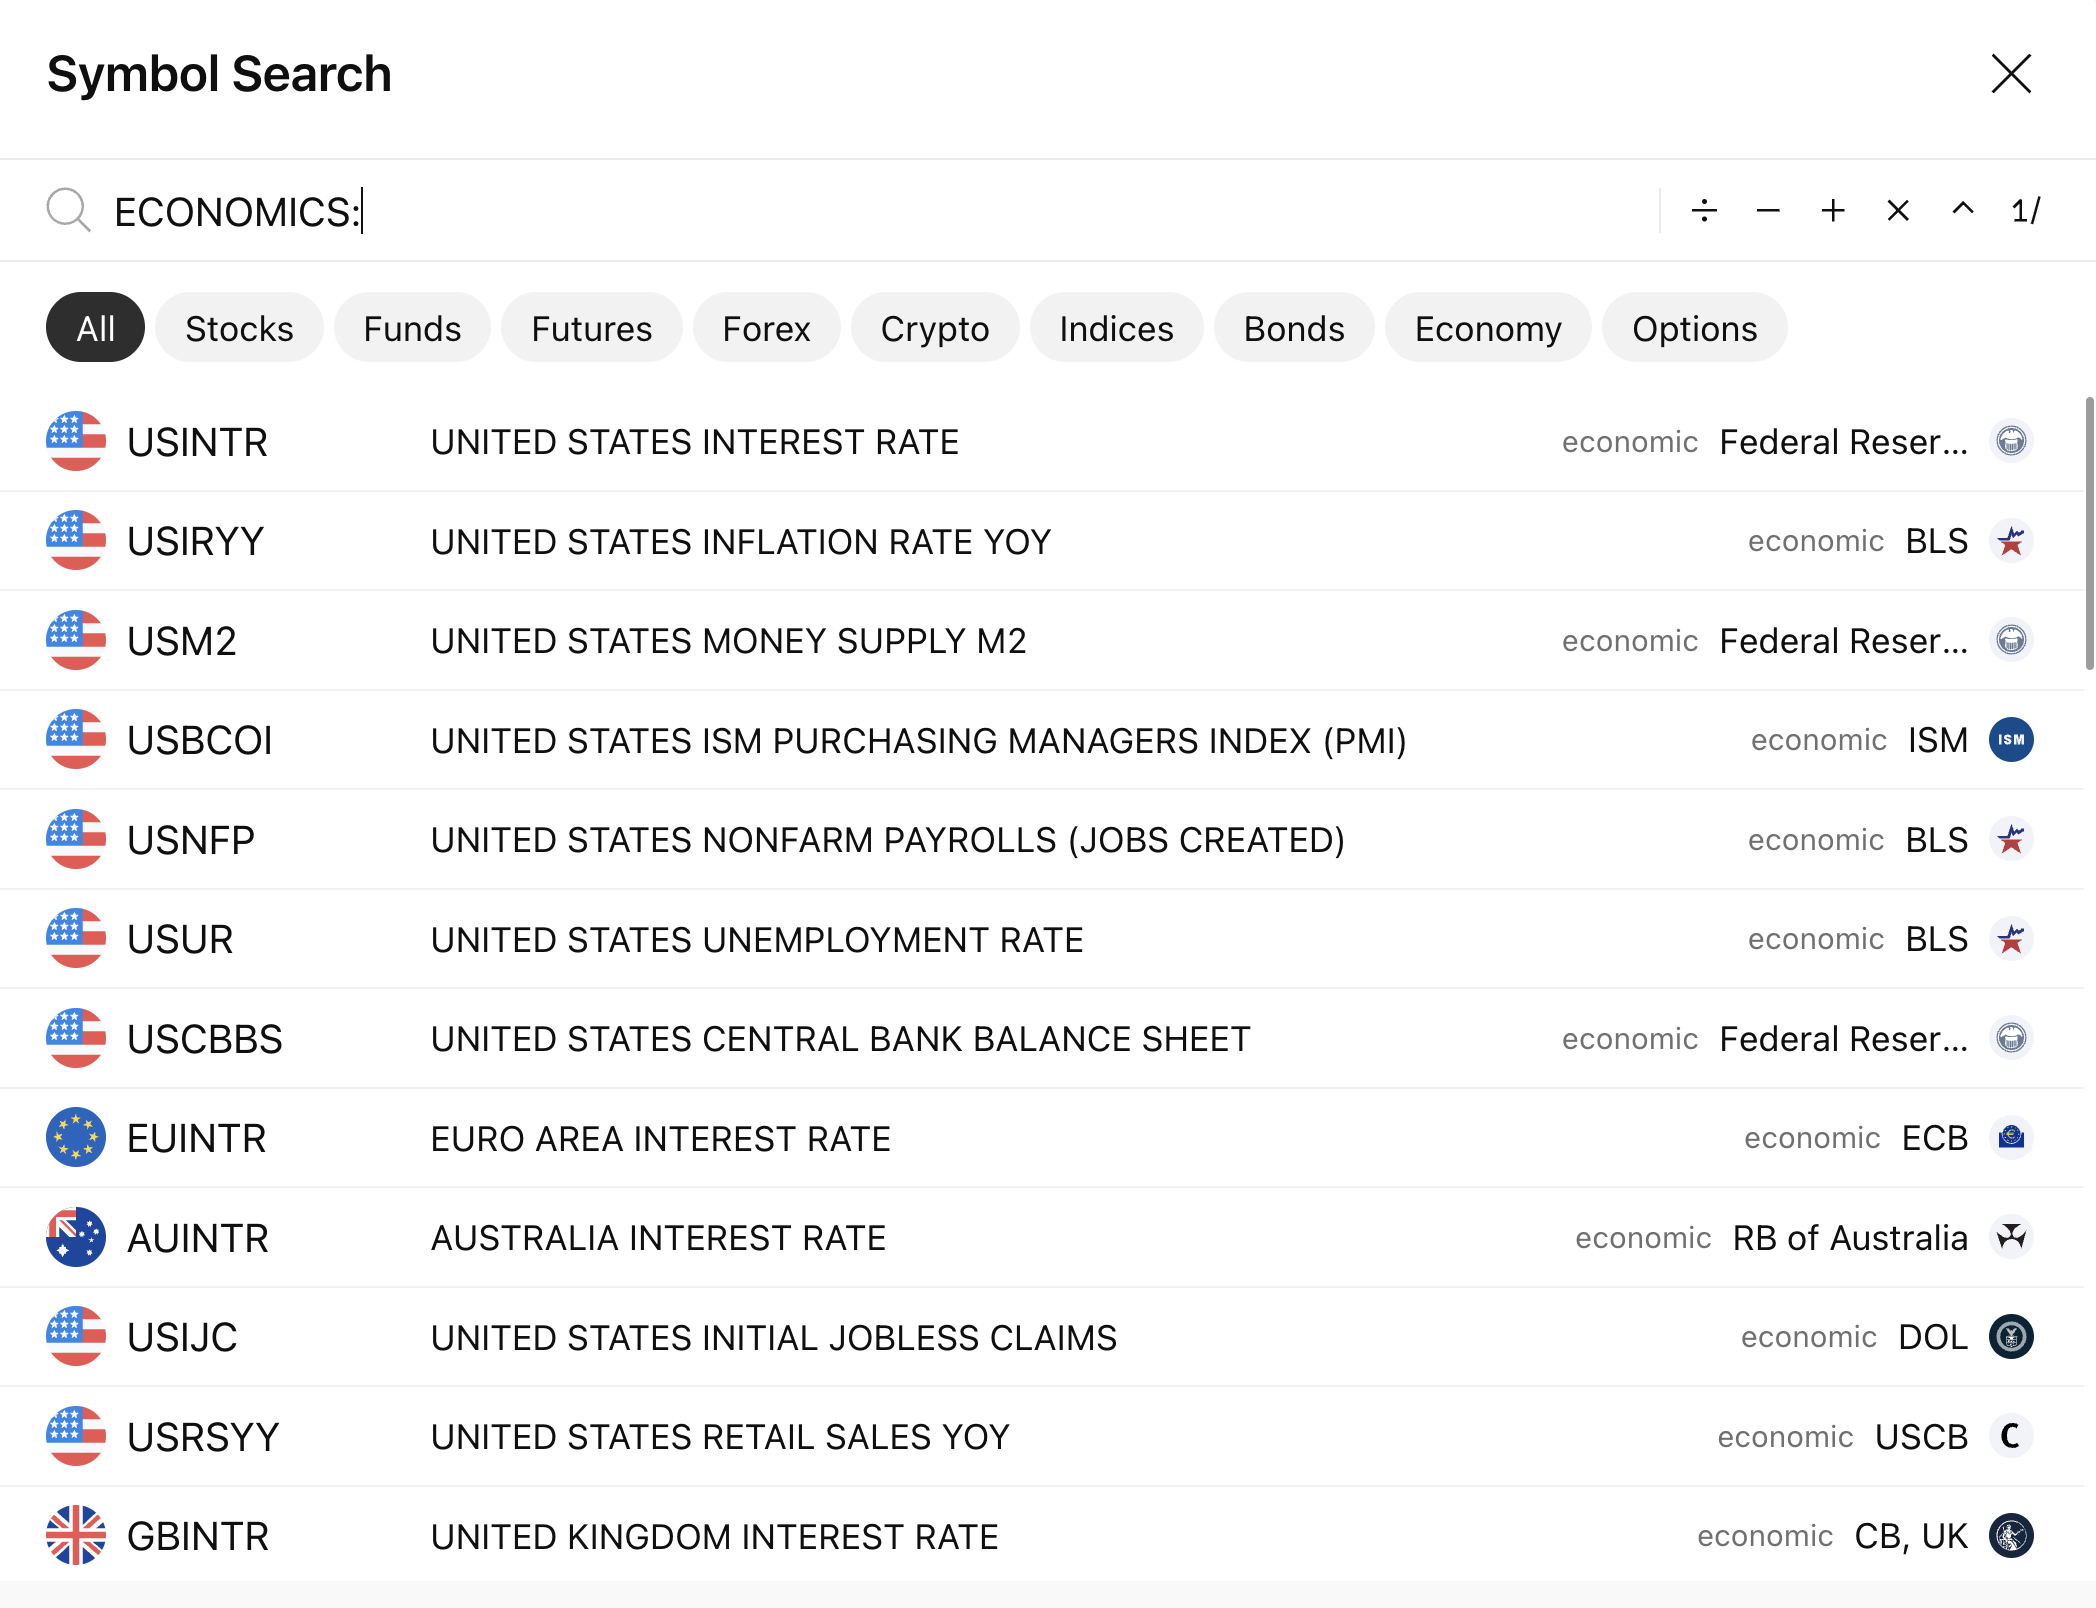
You can also find economic data in the search either by the prefix ECONOMICS:
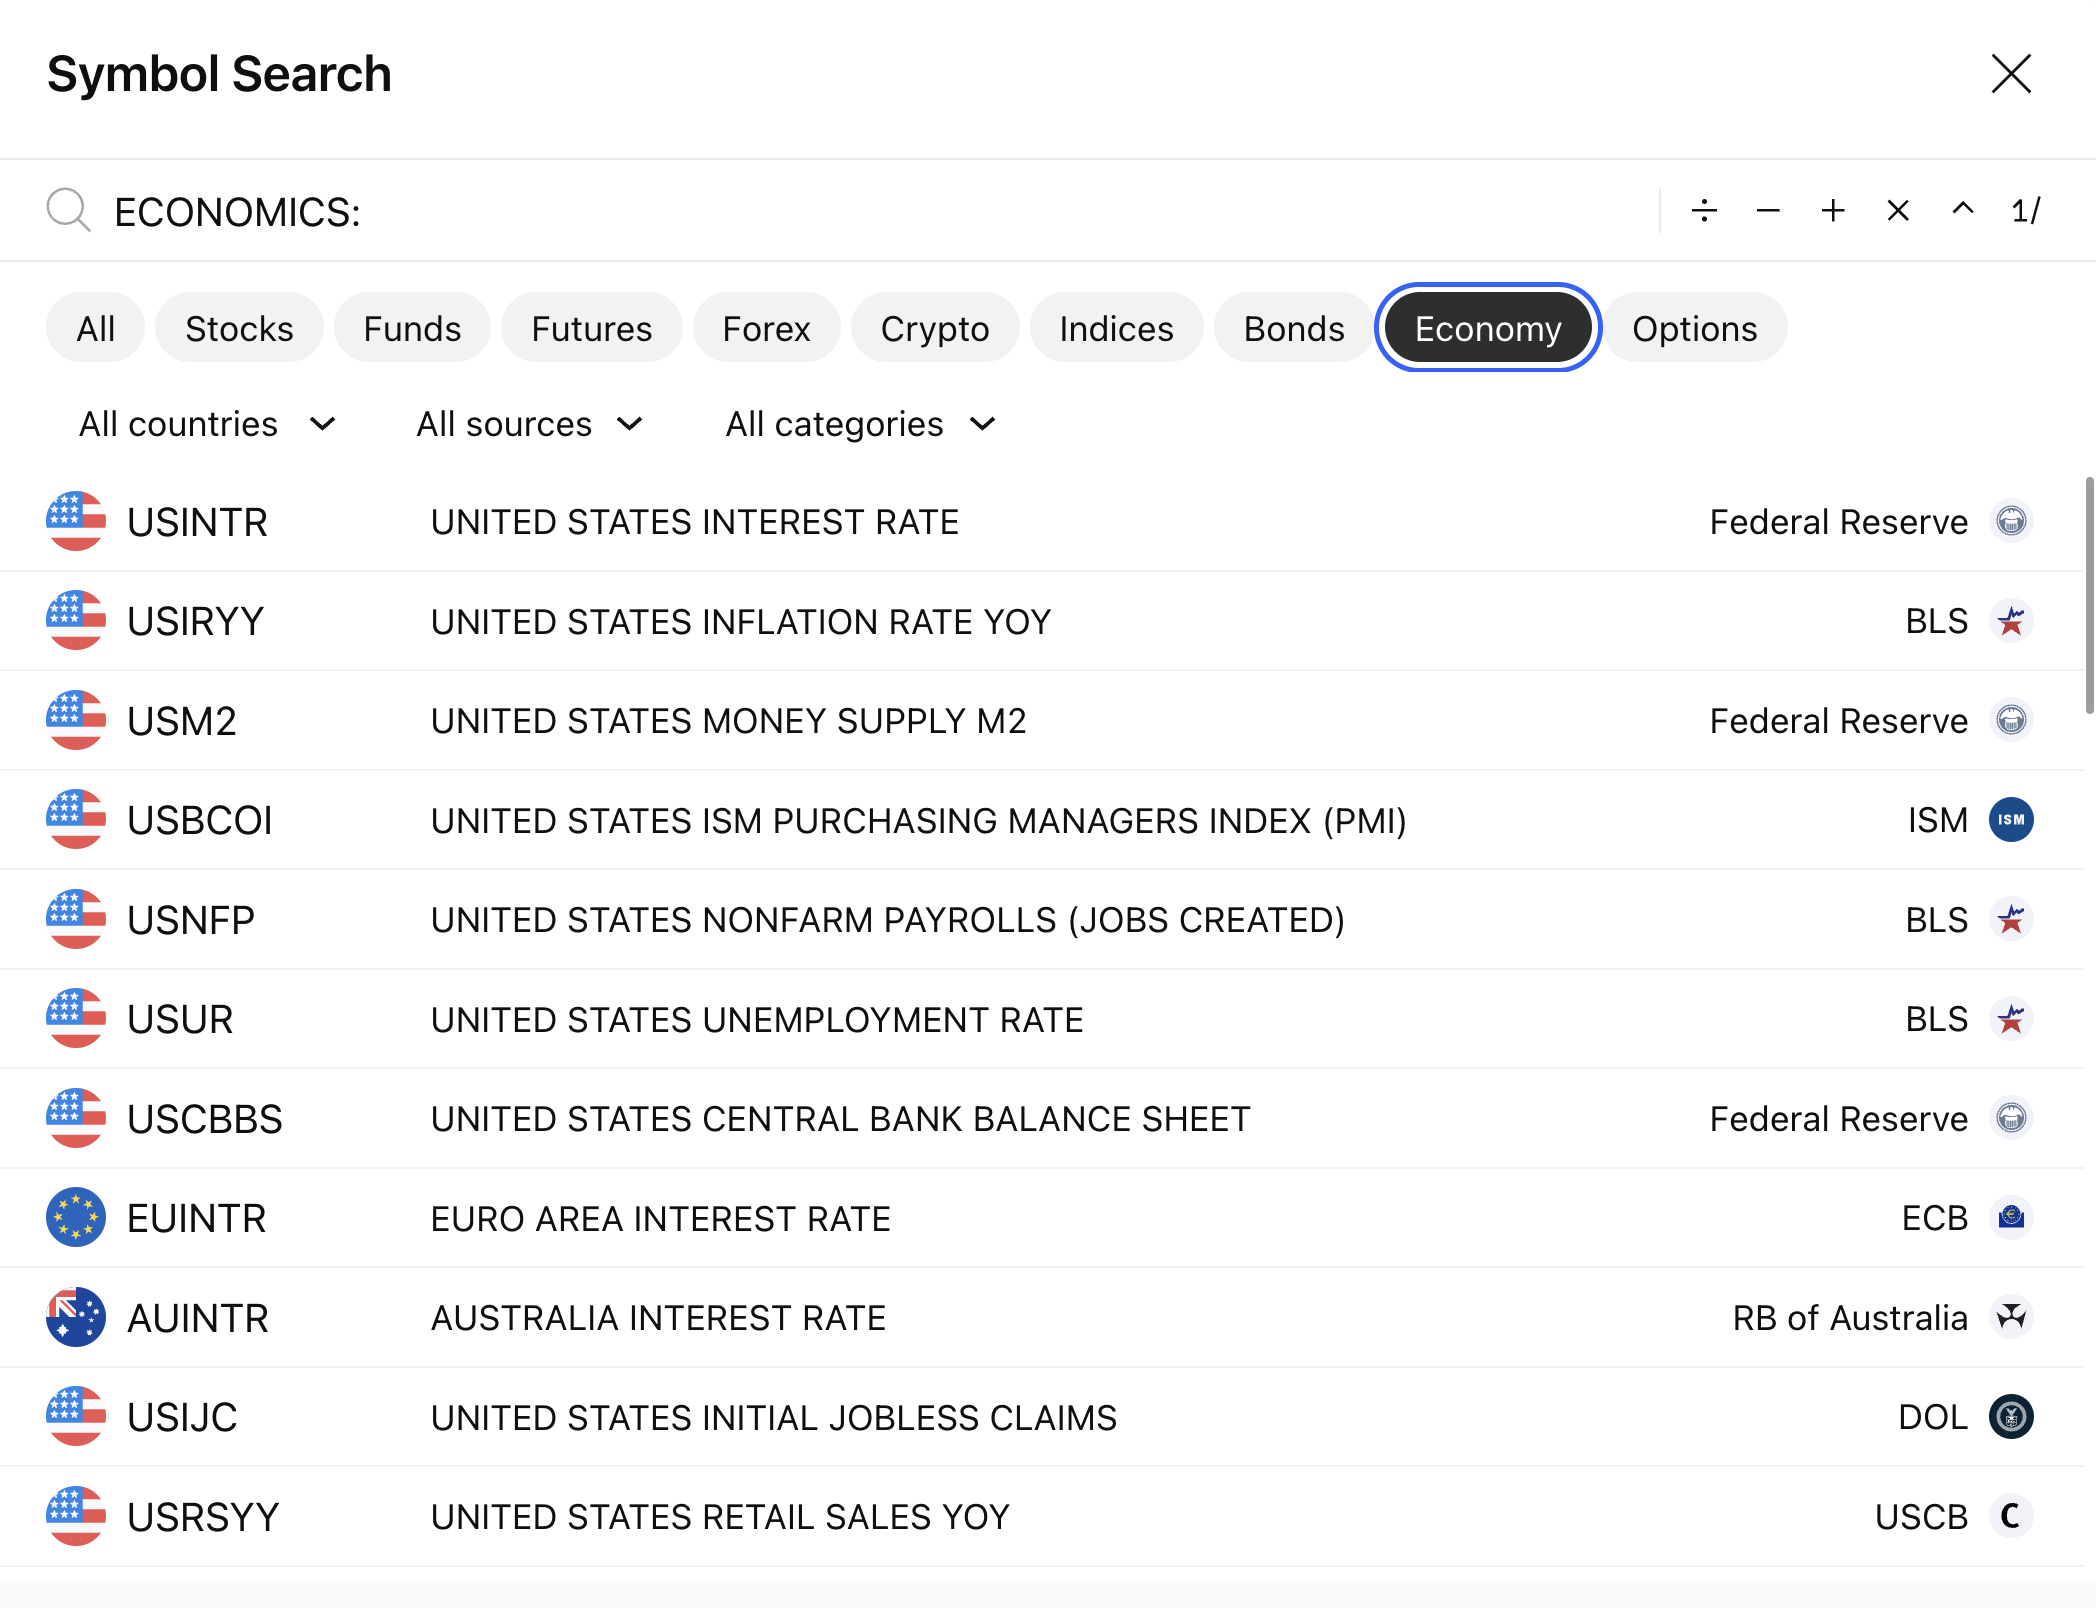
or by selecting the ECONOMICS exchange as the "source":
A complete list of available metrics can be found here.