Note: This documentation applies to the Nuvexlens Advanced Charting System. Nuvexlens fully supports technical indicators and strategy backtesting to help you make smarter trading decisions.
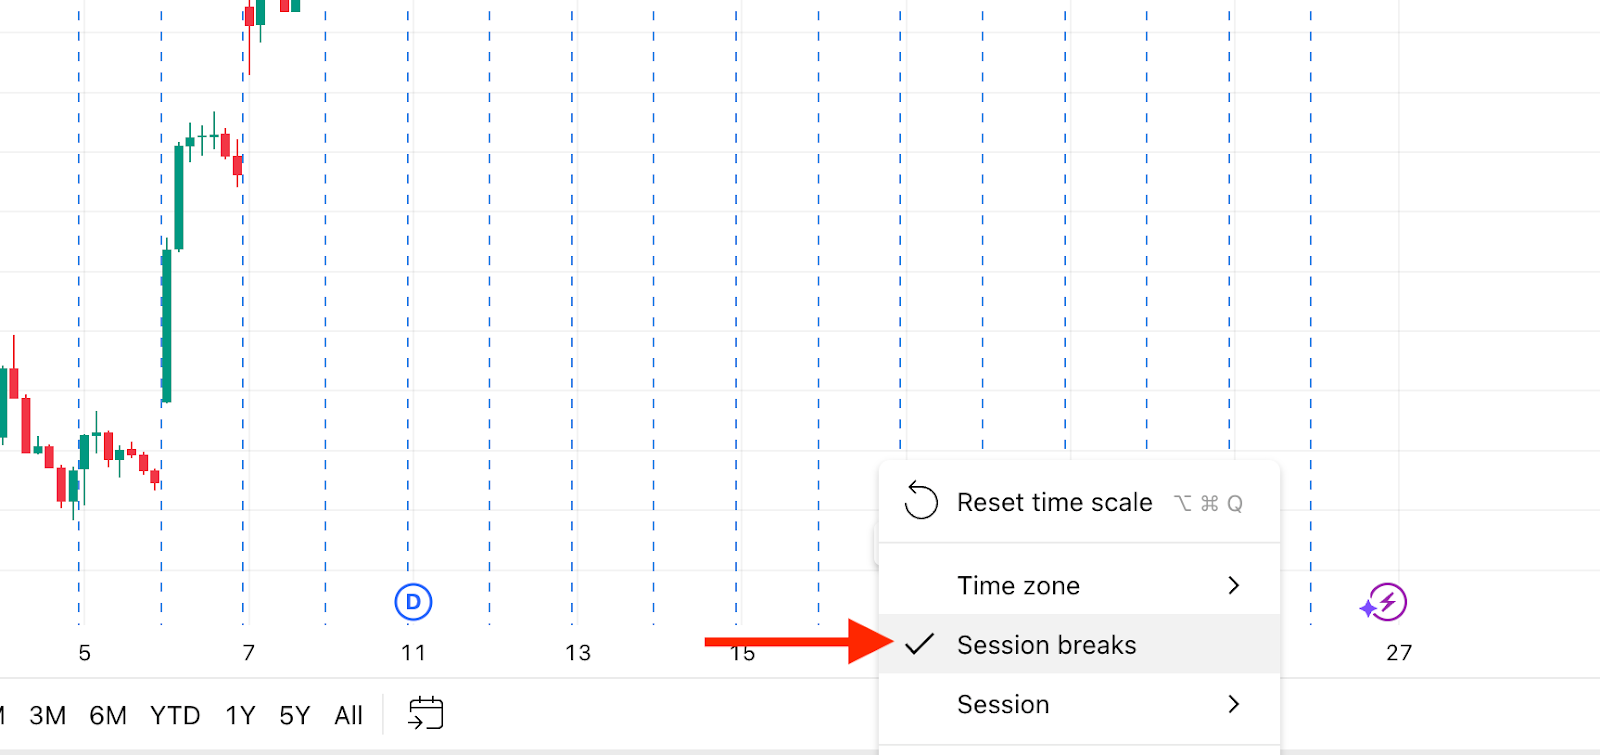
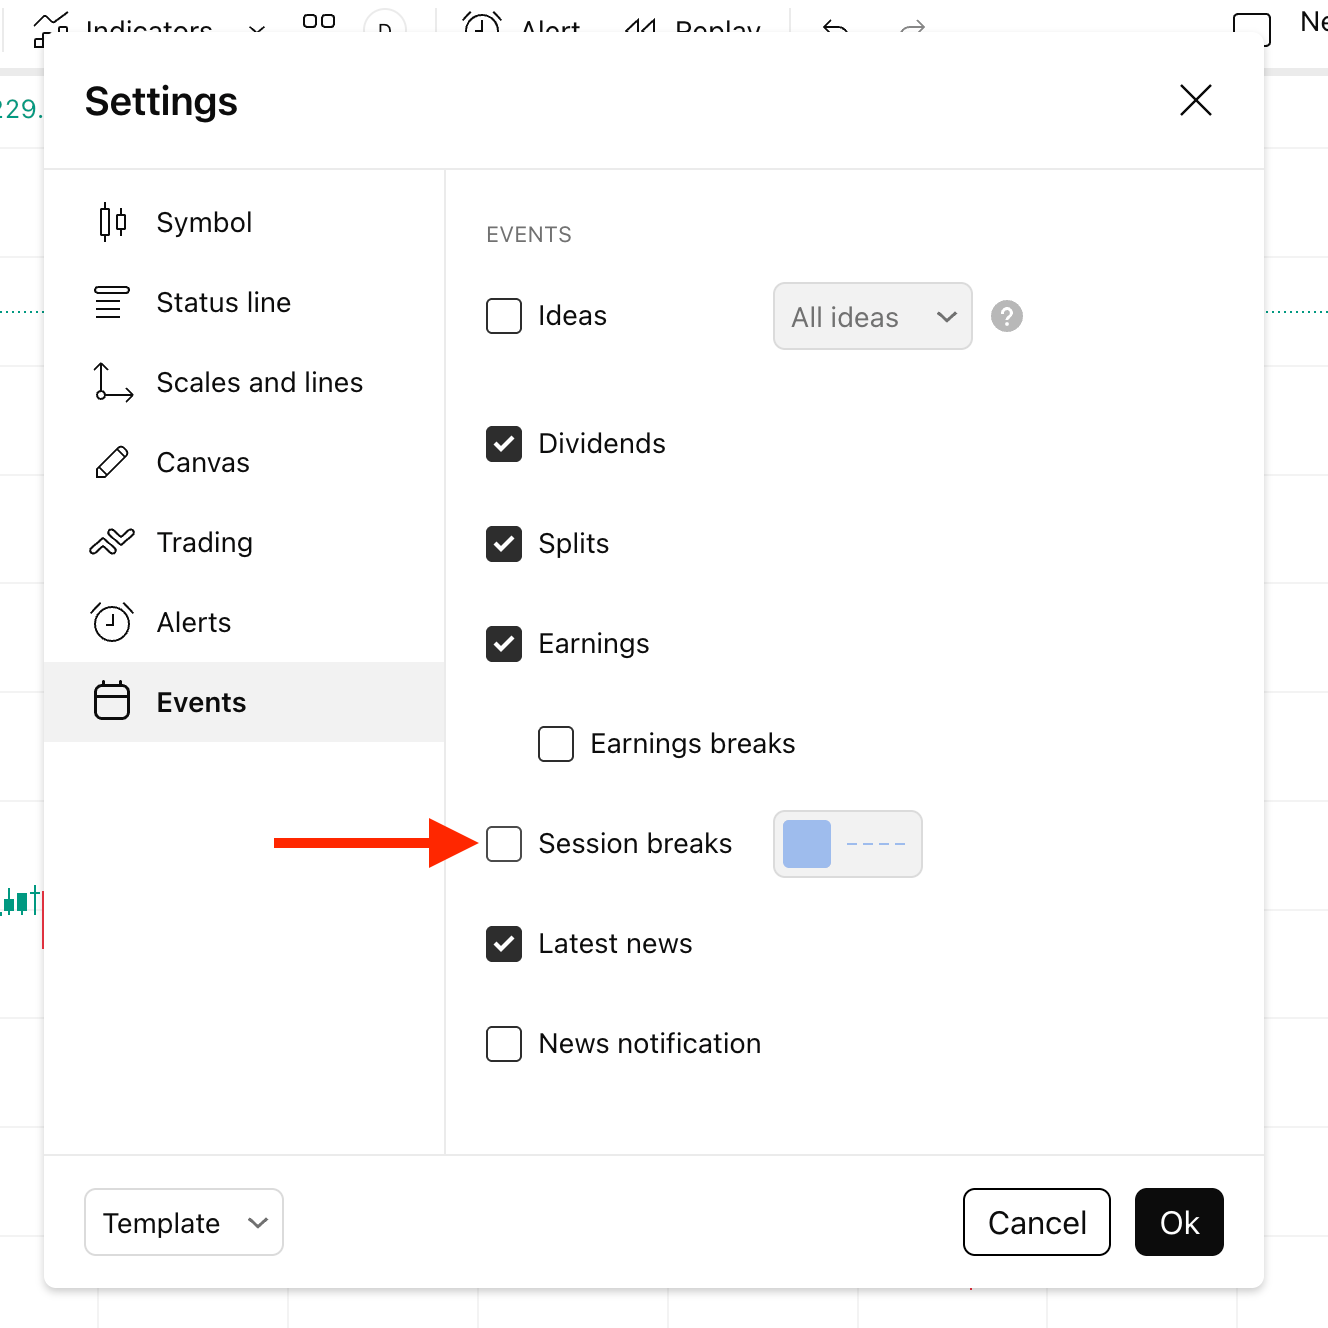
I cannot remove blue vertical lines on my chart
Blue vertical lines on an intraday chart indicate session breaks. You can disable their display in the Events settings:
Or the right-click context menu of the time scale: