Note: This documentation applies to the Nuvexlens Advanced Charting System. Nuvexlens fully supports technical indicators and strategy backtesting to help you make smarter trading decisions.
How can I keep chart position in time after applying a new interval?
If you want to maintain chart position in history after changing timeframe, you can enable Save chart left edge position when changing interval option in the chart settings menu, Scales and lines tab.
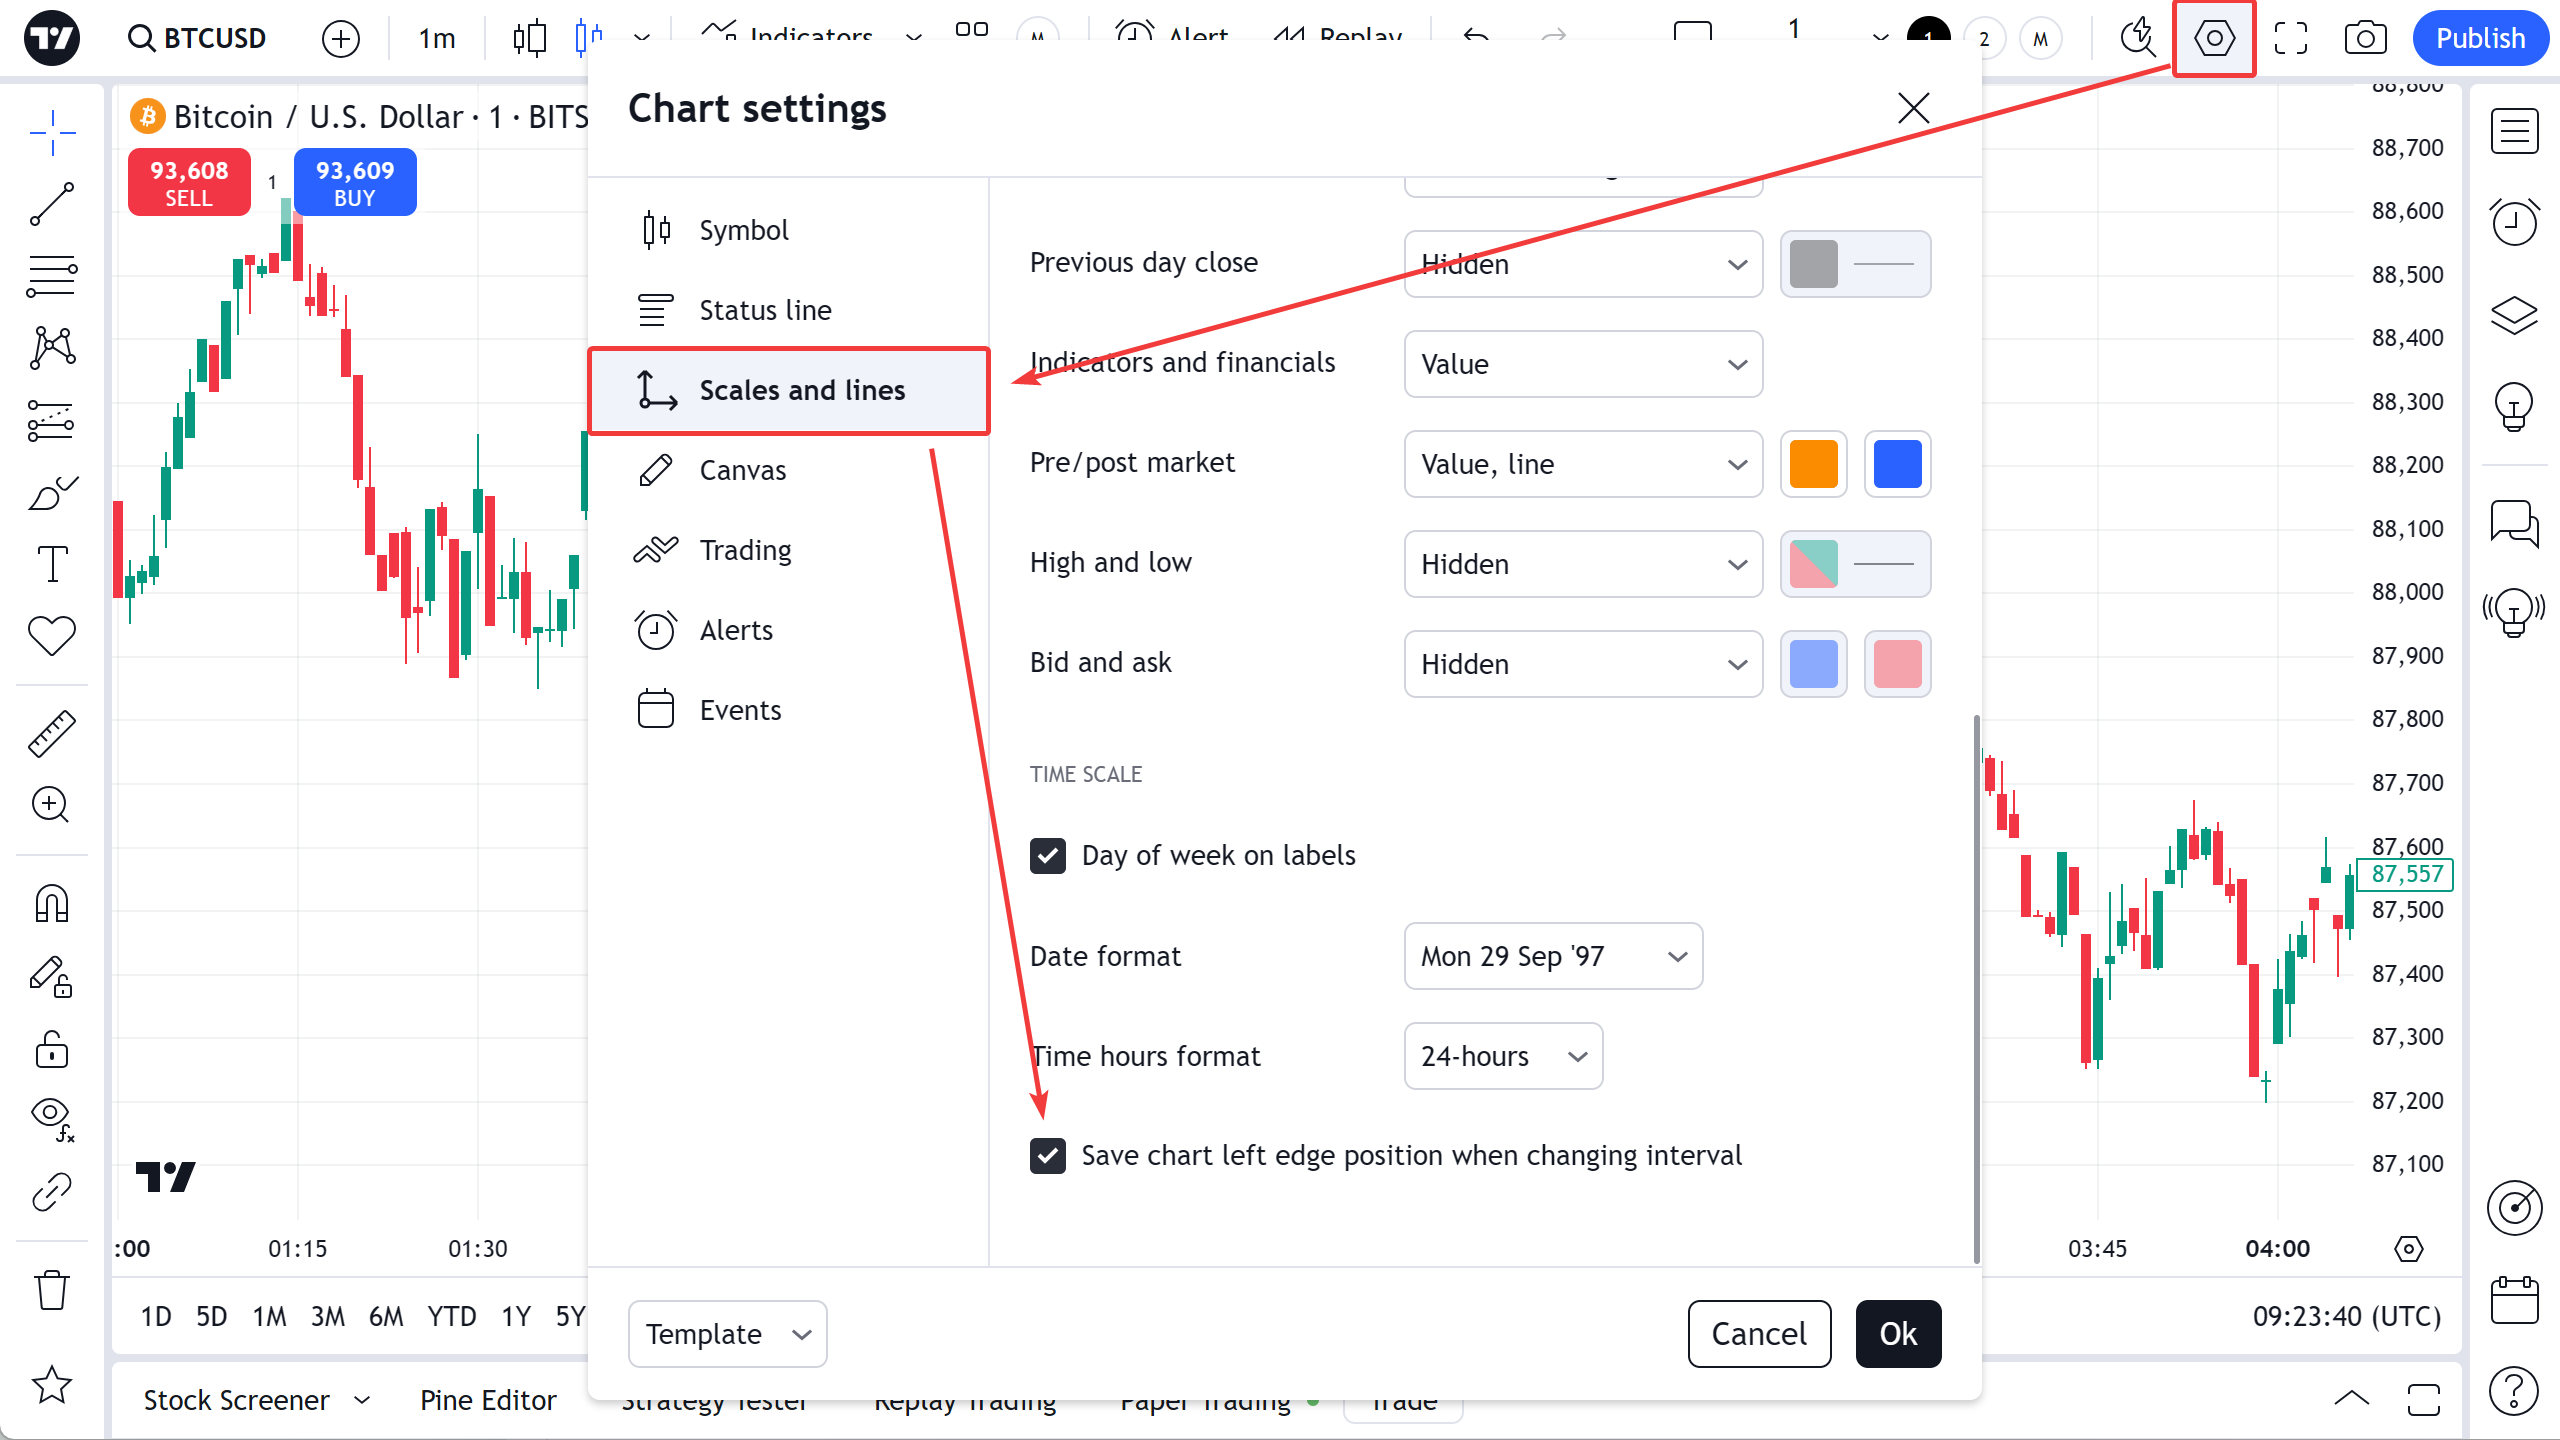
Enable this feature, and you will not need to scroll the chart to the position in time that you were looking at after applying a new interval. For example, you can switch from an interval of 1 hour to an interval of 30 minutes, and the chart will maintain the position in history.