Note: This documentation applies to the Nuvexlens Advanced Charting System. Nuvexlens fully supports technical indicators and strategy backtesting to help you make smarter trading decisions.
Why are the bars so thin?
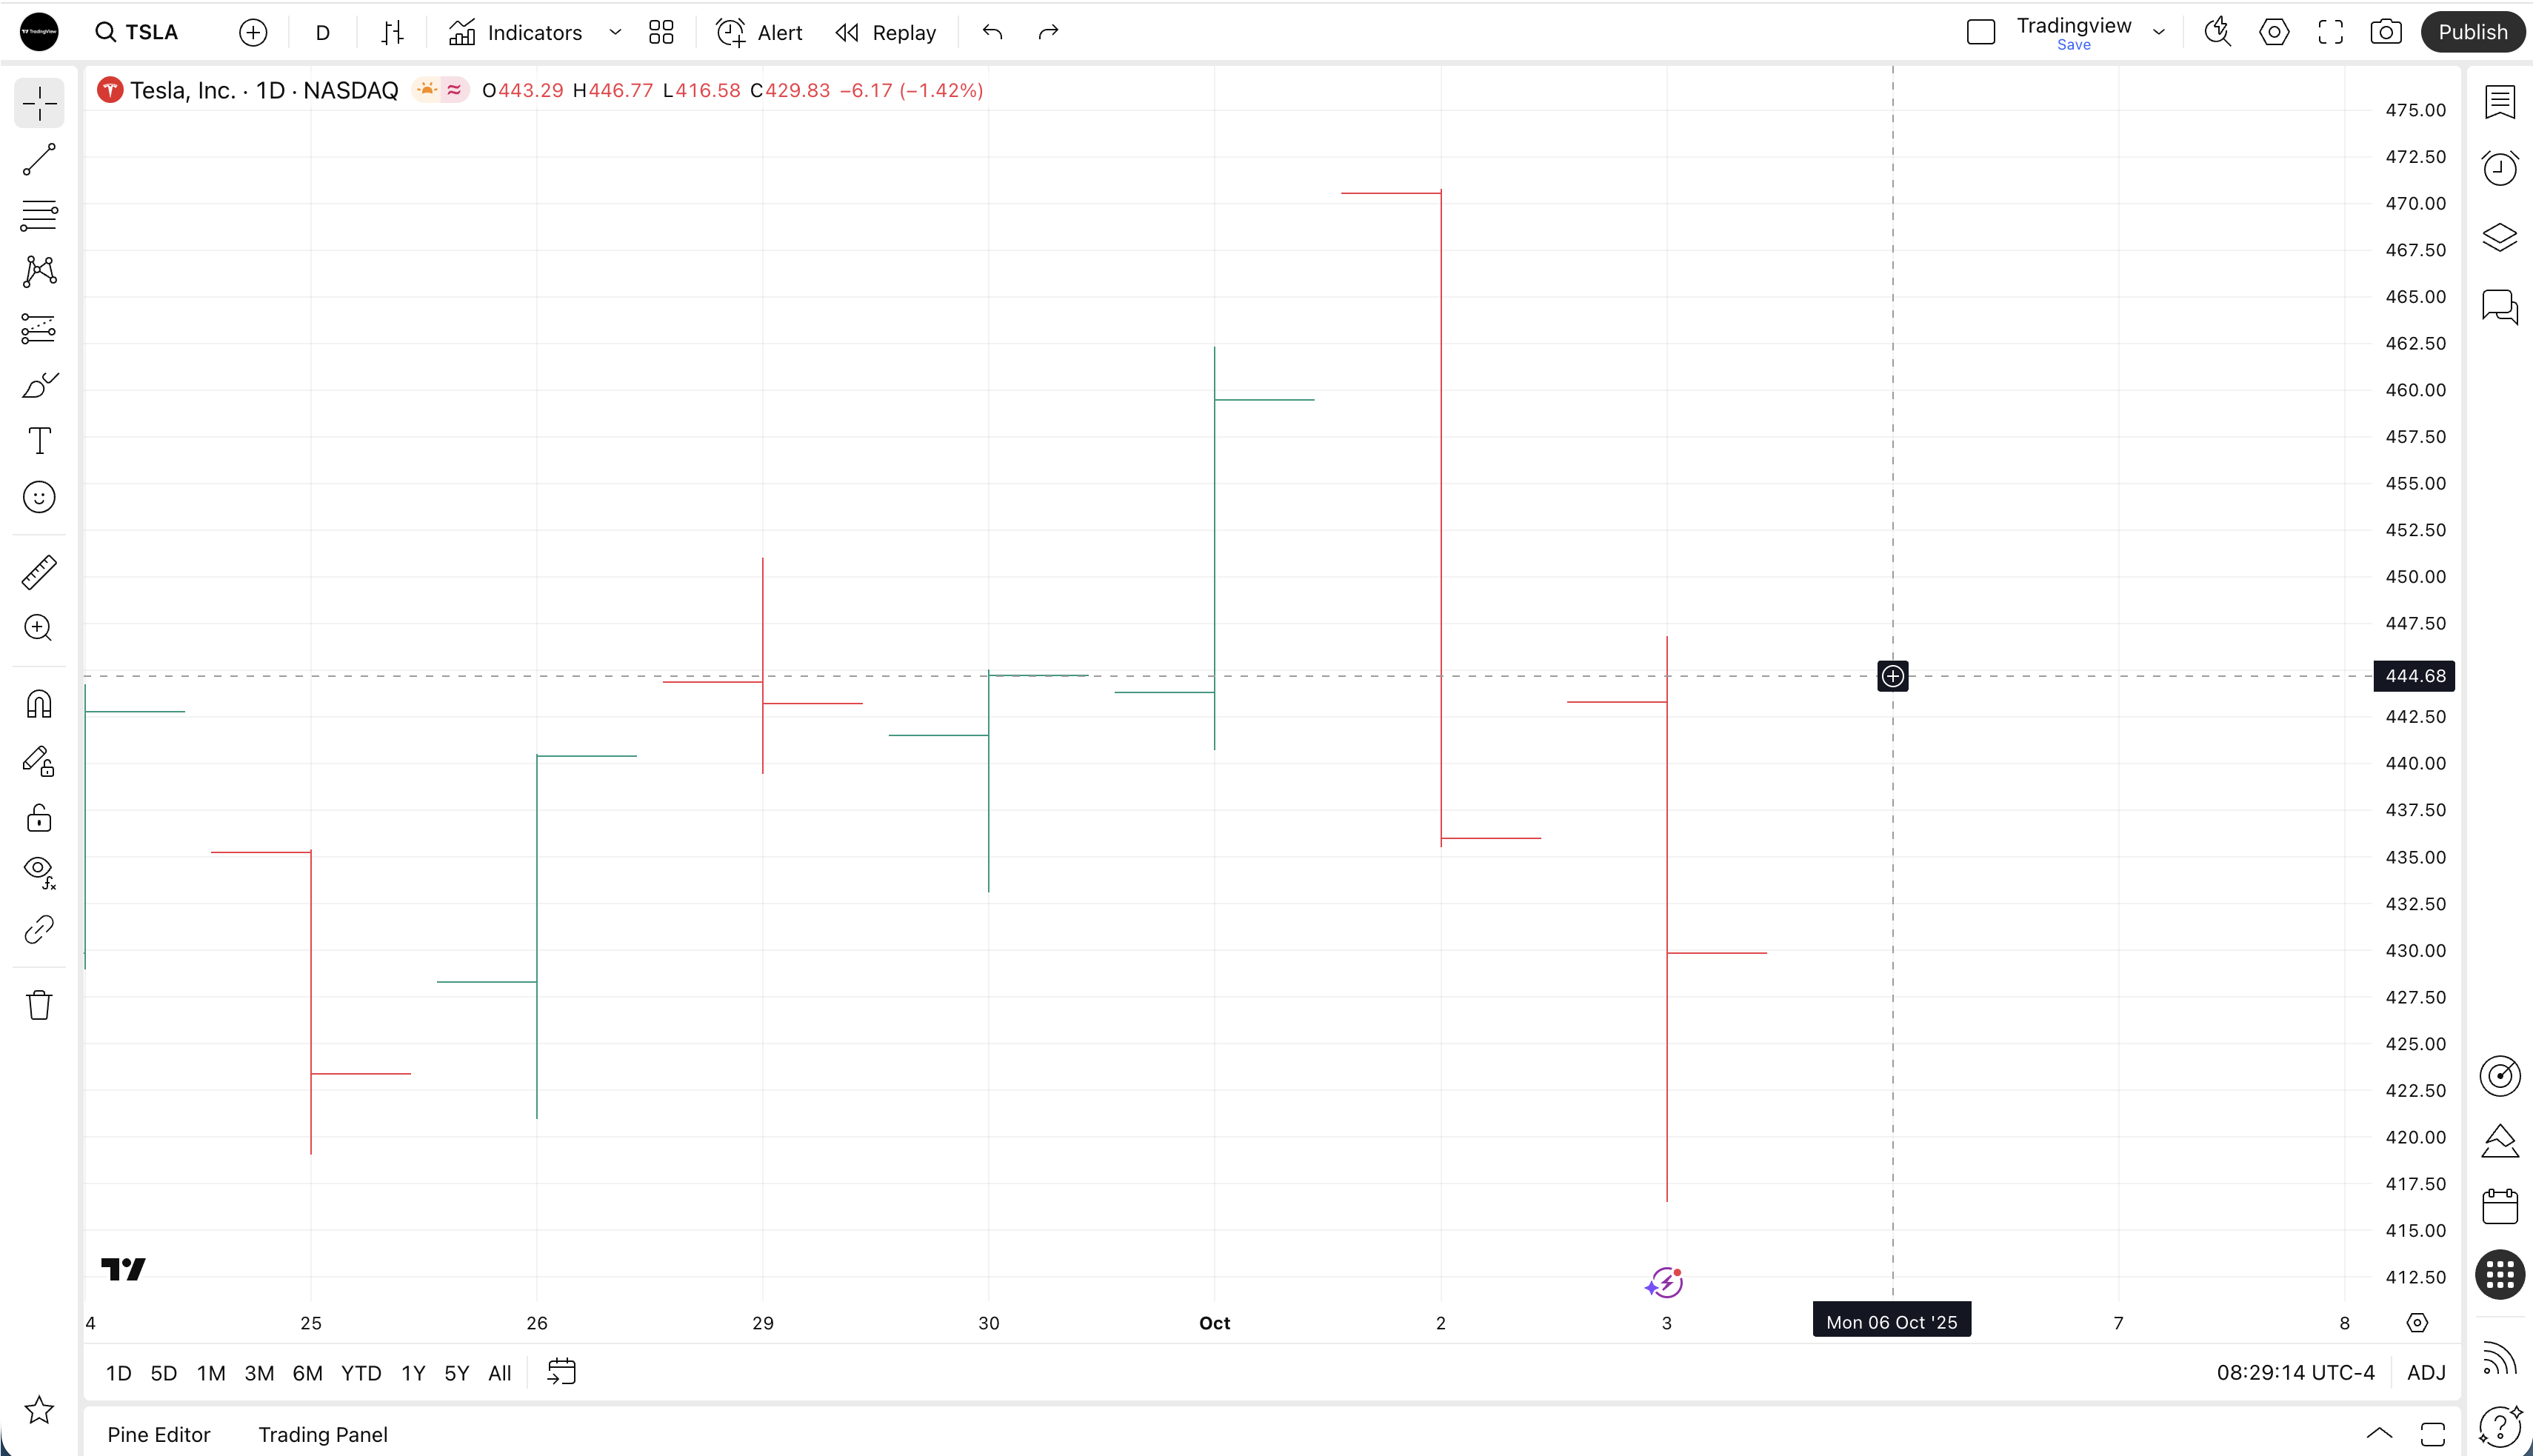
In technical analysis, you often need the ability to get accurate information about price movements quickly. Thin bars allow you to visually determine the levels (open, high, low, close) in as concise a format as possible, making it easier to read information faster.
In our thin bars mode, the opening and closing price notches are accurately drawn at the corresponding levels. When the thin bars mode is disabled, a small horizontal line can cross several price values.

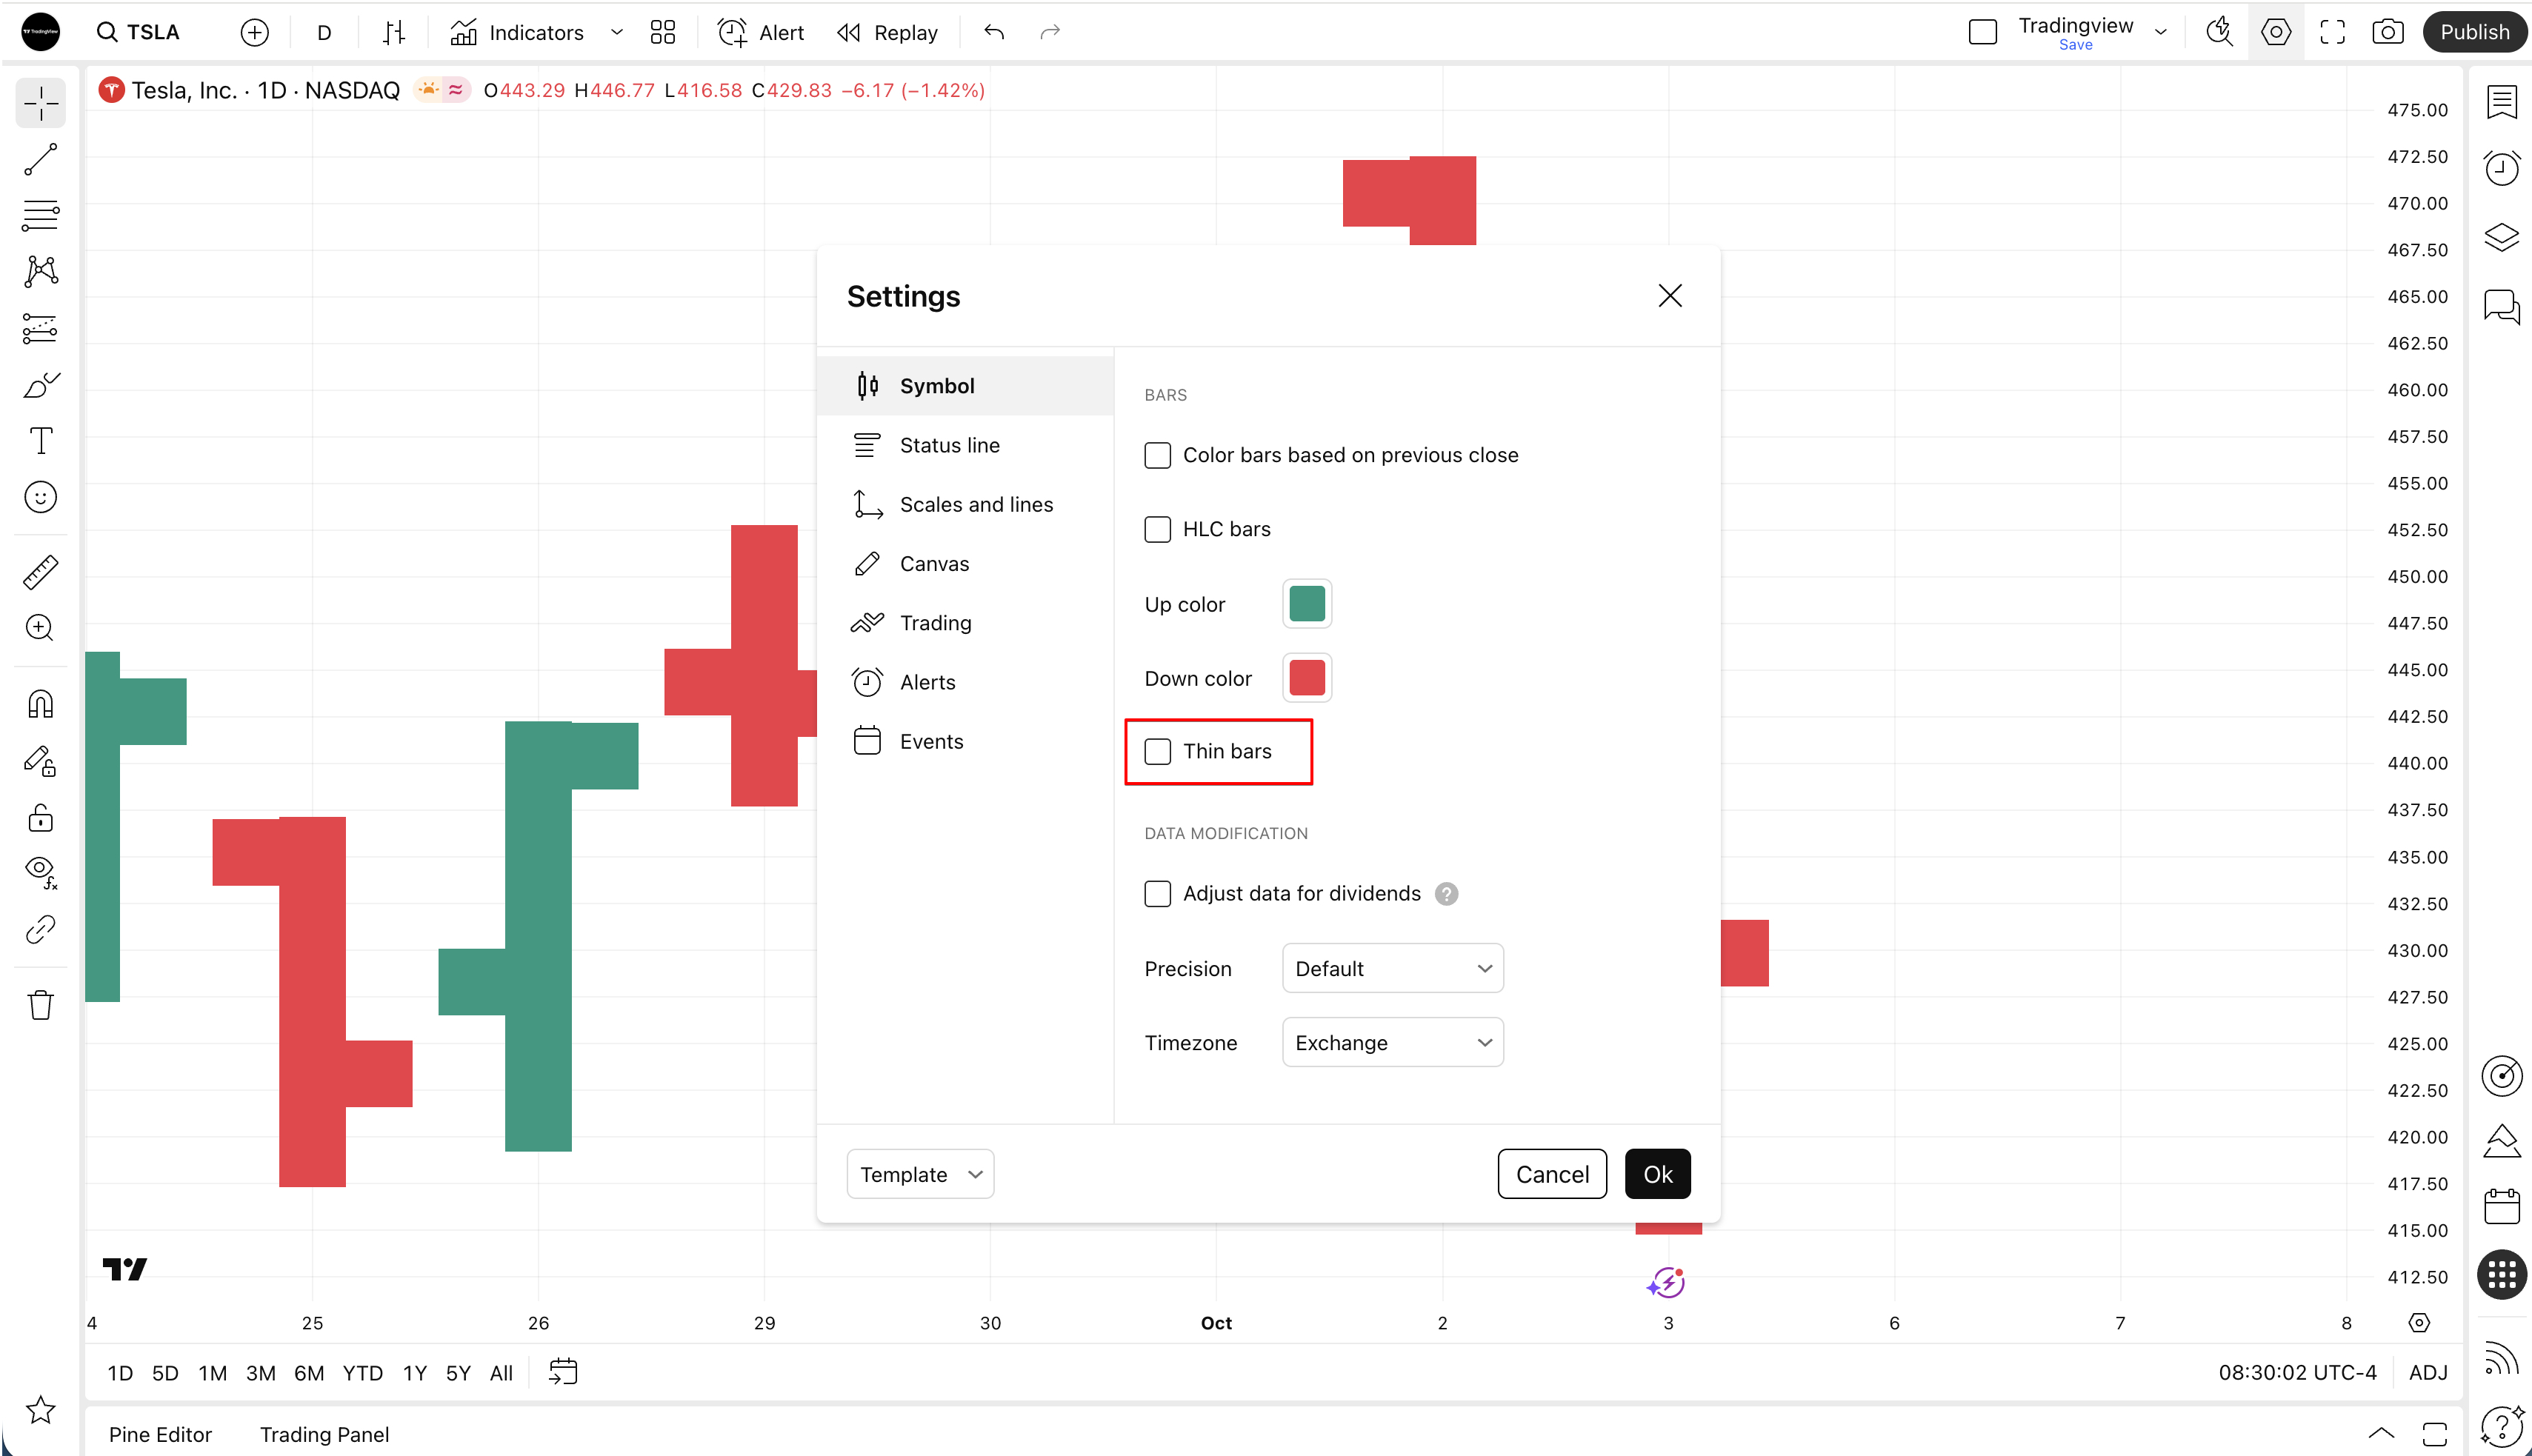
You can disable the thin bars mode in the chart settings.