Note: This documentation applies to the Nuvexlens Advanced Charting System. Nuvexlens fully supports technical indicators and strategy backtesting to help you make smarter trading decisions.
How can I enable/disable colored circles/dots of economic events on a chart?
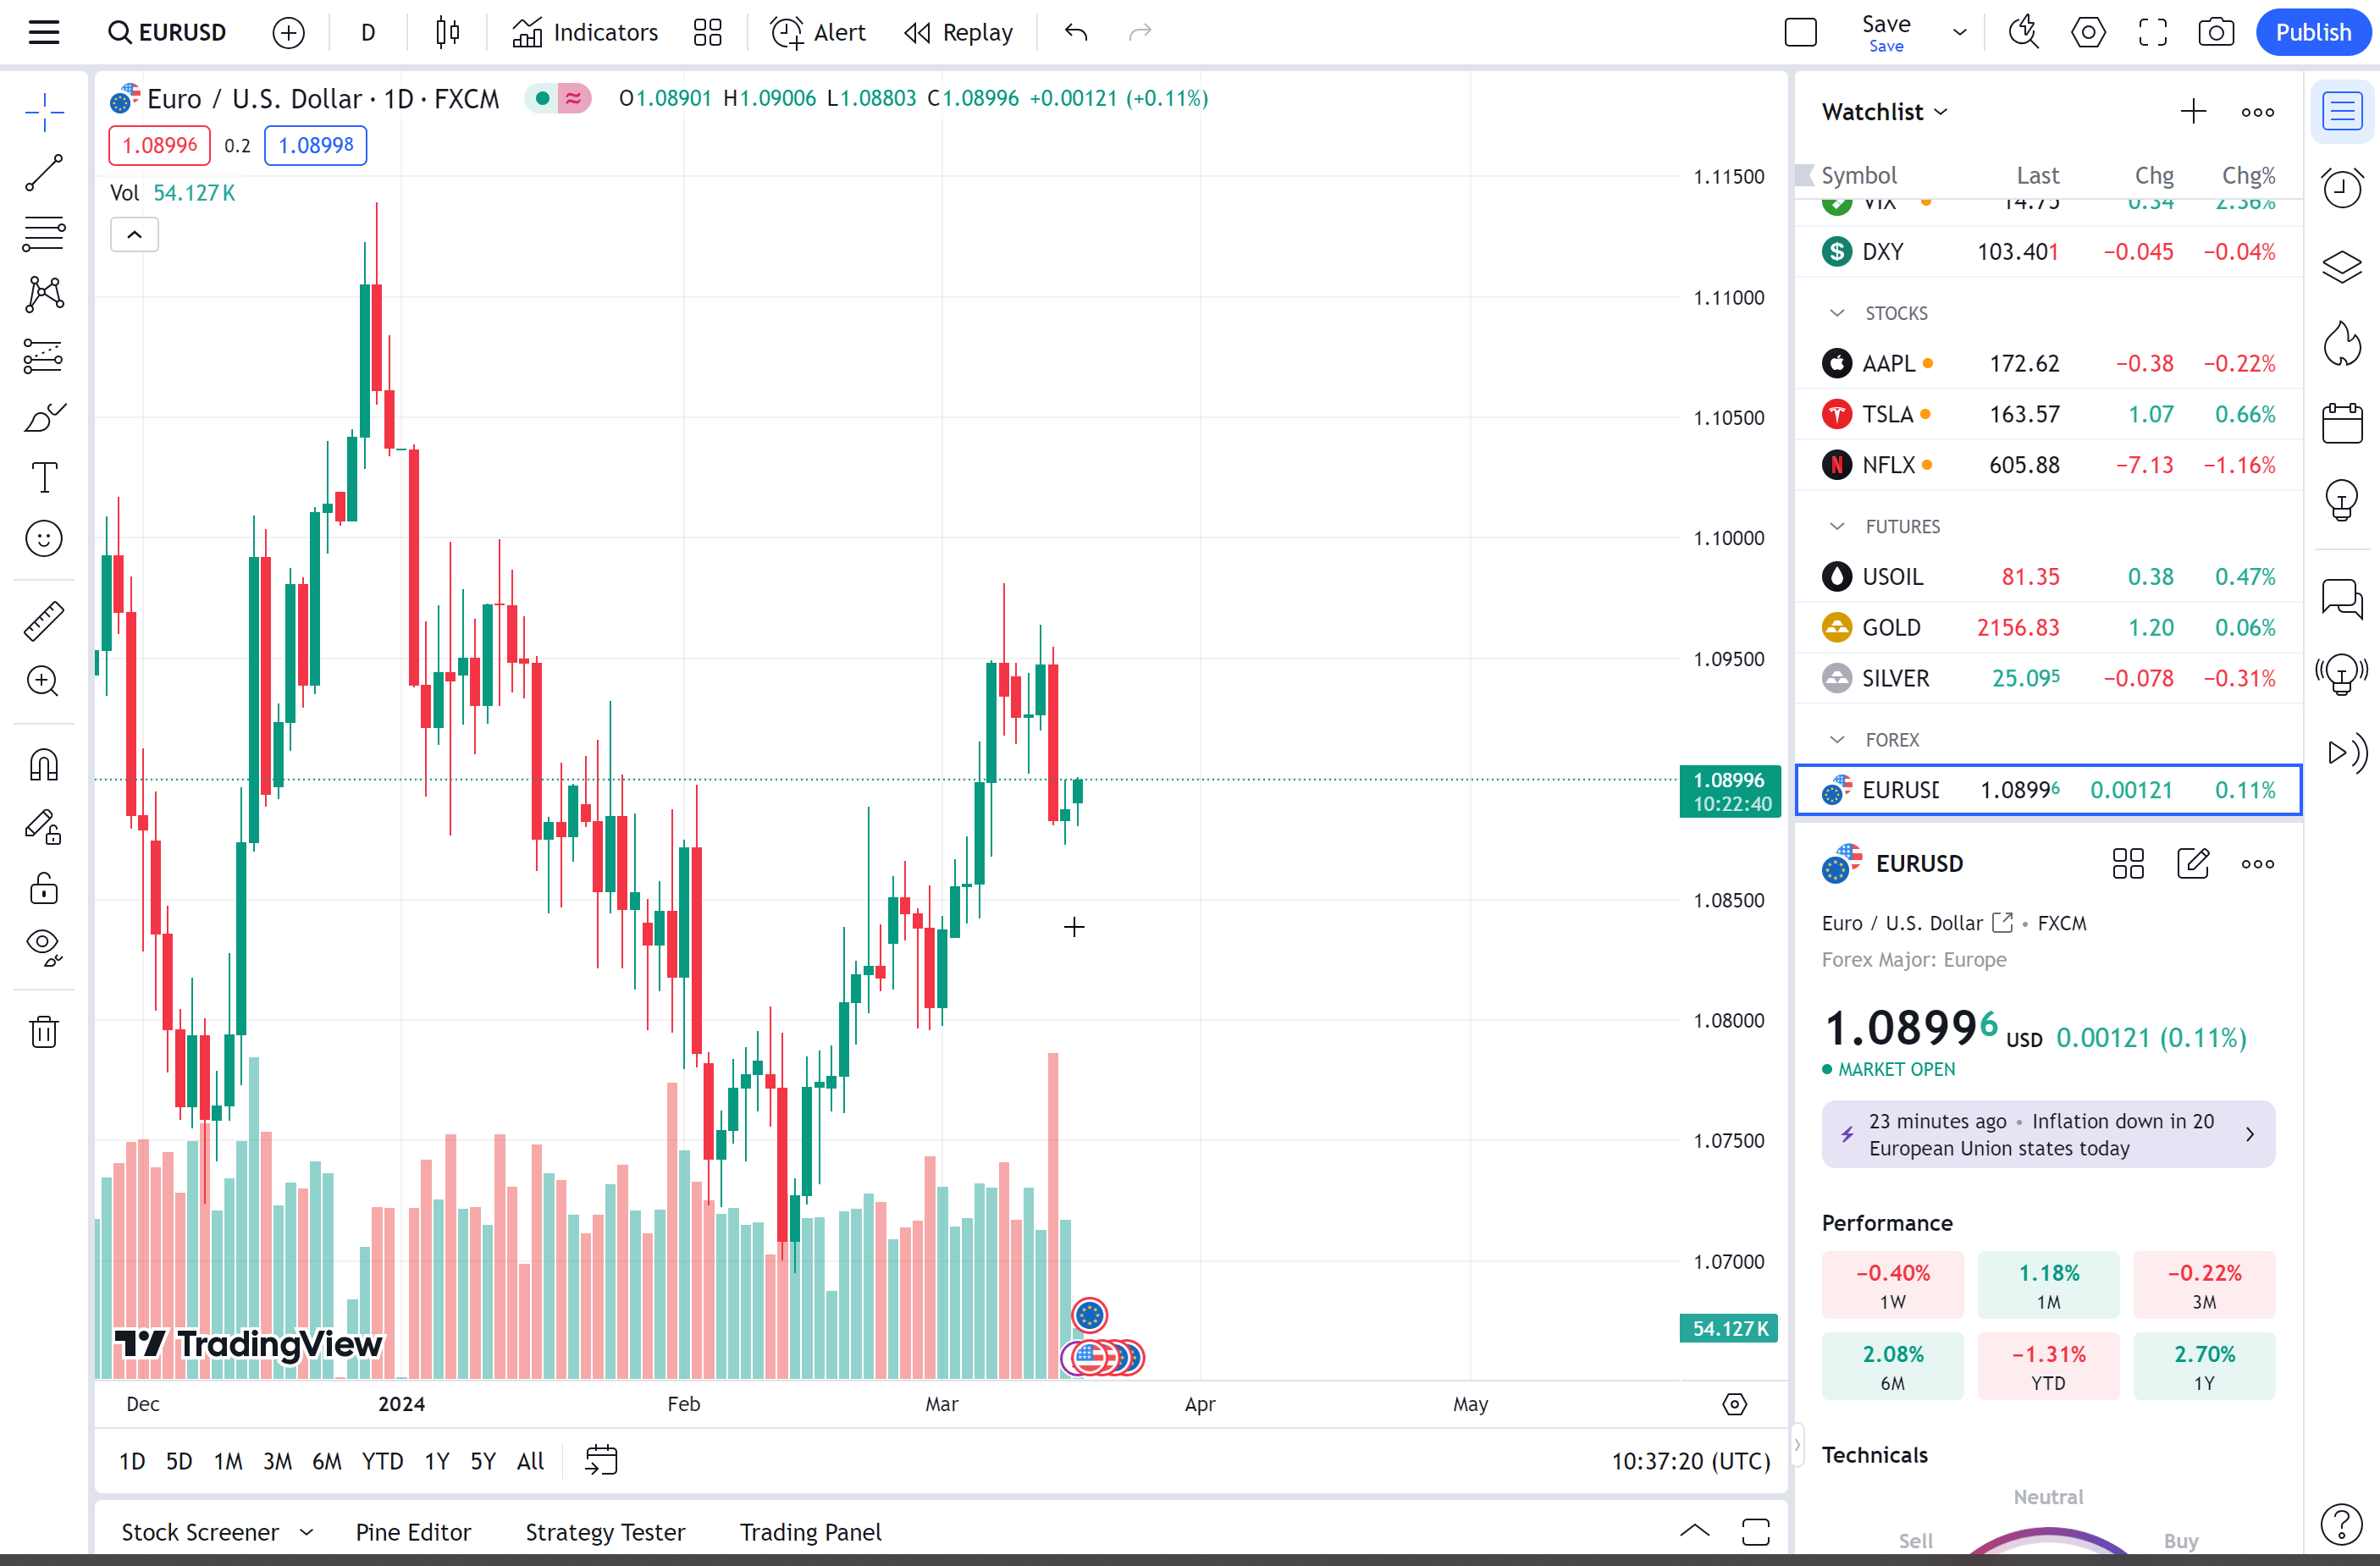
To enable or disable economic events on the chart, open the Chart Properties dialog, go to the Events tab, then disable or enable Show Economic Events on Chart.